Plot recipe for benchmarking algorithms #75
Comments
|
This is nice, and for sure it would be better to have one. Based on my experience, the speed of different algorithms highly depends on the parameters. For those schemes with adaptive time steps, better performances are usually achieved by taking larger time steps than those schemes that require a fixed time step. However, in my test cases the performance differences between schemes are not that important. I once tried to run 1e6 ions in an Earth-like EM field on my laptop for one case, and it could be finished in about 10 minutes. For now, I think our priority is to make sure that the solution is physically correct with selective numerical schemes, which is the goal in #73. The benchmark can be helpful after we confirm that the chosen schemes are accurate. |
|
Now there's a native implementation of the Boris method, we can also add that to the list. The memory consumption for the Boris method is much lower, and the speed can be sometimes an order of magnitude faster. |
|
Since SciML already includes a full suite of benchmarks for the general ODE algorithms, we may not need to reproduce them here. If at a certain point in the future we have the motivation to do this, let's reopen this. |
In my OSPP project proposal, I mentioned that I wanted to create a simple plot recipe for benchmarking different algorithms, but I did not complete this task at the time. But we do have this need, as demonstrated in the similar work done in #73 . Do you think we need this feature? @henry2004y
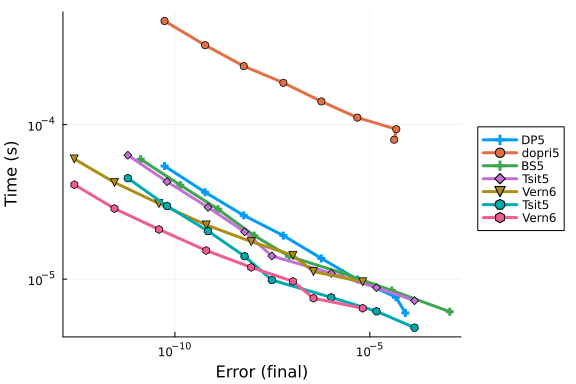
I want the benchmark plot to be able to mimic the implementation of sciml, outputting a scatter plot for different algorithms. The x-axis represents the error of a certain quantity. It seems that we can follow the design of other interactive plotting functions by passing in any function that meets the requirements and using its output as the x-axis, while setting time as the y-axis. Alternatively, we can also set another customizable quantity as the y-axis.
The results of the sciml benchmark are similar to this image:
The text was updated successfully, but these errors were encountered: