
It is a known fact that DevOps is the practice of managing the software development lifecycle through automation and collaboration. DevSecOps is the term used to describe a project or series of projects where IT operations teams work with developers to implement security protocols into their code base. What they want to do is improve security in a way that allows them to be more agile and make better decisions about what security features are needed.
Earlier security was tested at the last of the lifecycle but with the advancement of open-source and cloud technologies. We welcome some unwanted dependencies that can easily be detected in the initial stages to decrease the time to market and the cost it takes to find the same problem at the end of the cycle. As discussed in the Supply chain article Containers sometimes blur the line between the application and infrastructure and can be part of both misconfigurations and vulnerabilities. Hence it’s better to implement DevSecOps in the pipeline to combine security in the DevOps workflow.
In this Project, we will be creating a DevSecOps Pipeline to Deploy a 3-Tier Java-based application using different DevSecOps Tools and Principles. So let’s get started.
Source Code: : HERE
During this hands-on experience, we'll be using non-free computing services, which may incur costs. For more information, please consult the AWS pricing page.
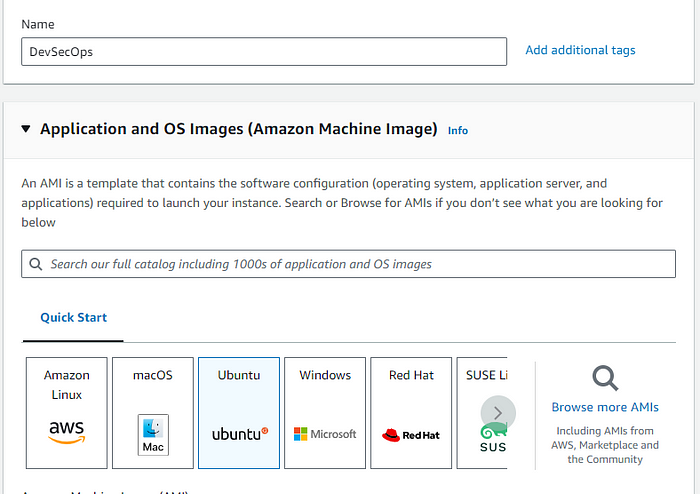
We will start by creating an instance for our Jenkins Server, We will be using a lot of tools and plugins hence use the following specifications for the instance:
-
Ubuntu 22.04 image( free tier eligible)
-
t2-large for the instance type(not free)
-
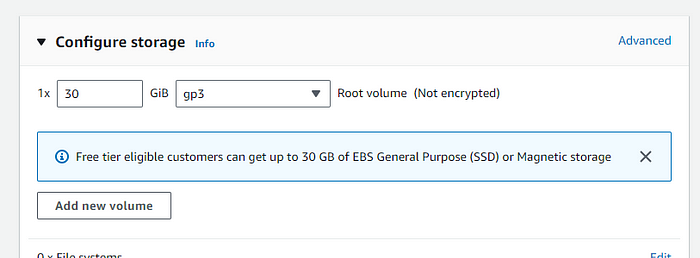
Storage as 30GB as build can take a lot of storage.
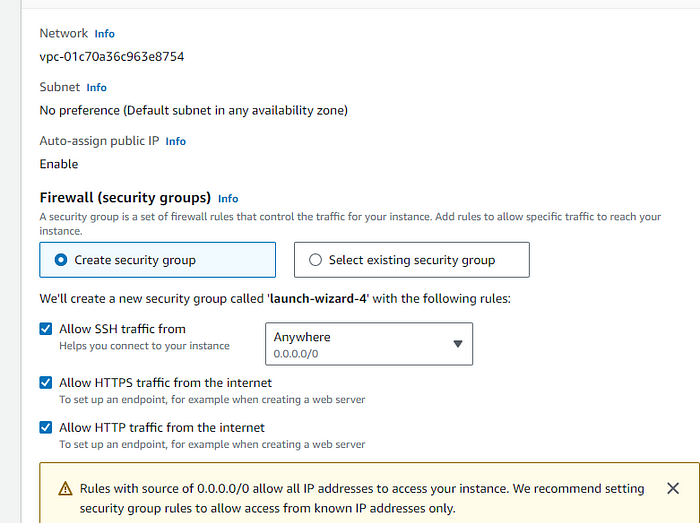
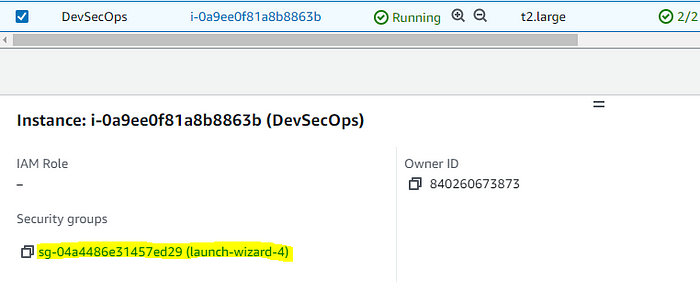
In the security group section, open the http and https ports for demonstration purposes you can even select the IP or the security group you want to only allow access to. Further, we will add some more rules to the security group.
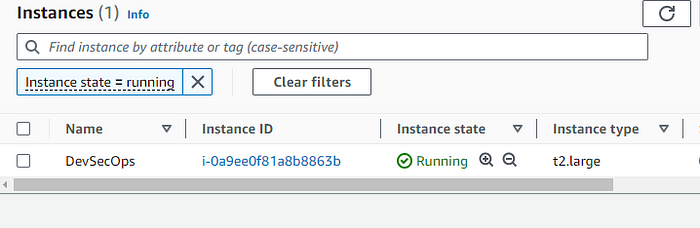
After all the settings, click on the Create instance button. After your instance is up and running it's time to install Jenkins in it.
Jenkins is a free, open-source software that automates all the release steps of a typical software project lifecycle, from definition to delivery. You will be using it to set up the CI/CD pipeline for your project.
Start by creating a script file :
Copyvi jenkins.sh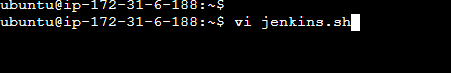
Copy the content in the script:
Copy#!/bin/bash
sudo apt update -y
#sudo apt upgrade -y
wget -O - https://packages.adoptium.net/artifactory/api/gpg/key/public | tee /etc/apt/keyrings/adoptium.asc
echo "deb [signed-by=/etc/apt/keyrings/adoptium.asc] https://packages.adoptium.net/artifactory/deb $(awk -F= '/^VERSION_CODENAME/{print$2}' /etc/os-release) main" | tee /etc/apt/sources.list.d/adoptium.list
sudo apt update -y
sudo apt install temurin-17-jdk -y
/usr/bin/java --version
curl -fsSL https://pkg.jenkins.io/debian-stable/jenkins.io-2023.key | sudo tee \
                  /usr/share/keyrings/jenkins-keyring.asc > /dev/null
echo deb [signed-by=/usr/share/keyrings/jenkins-keyring.asc] \
                  https://pkg.jenkins.io/debian-stable binary/ | sudo tee \
                              /etc/apt/sources.list.d/jenkins.list > /dev/null
sudo apt-get update -y
sudo apt-get install jenkins -y
sudo systemctl start jenkins
sudo systemctl status jenkins
Running the script:
Copysudo chmod 777 jenkins.sh # granting permission
./jenkins.sh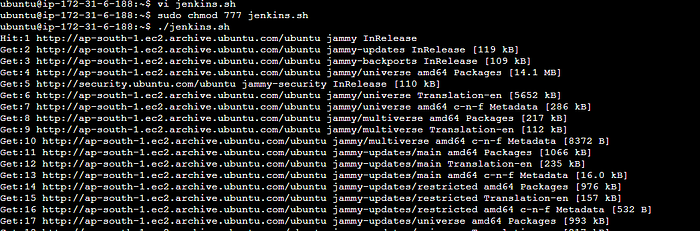
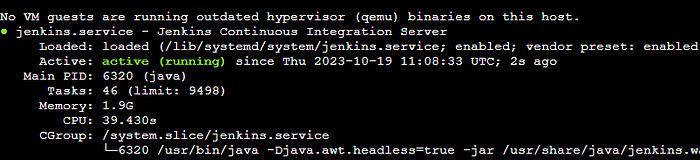
The status command shows that the Jenkins server is up and running.
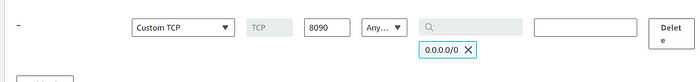
By default, Jenkins runs at port 8080, but as the application we will be using also runs on the same port, you will change the Jenkins port in the configuration file. First, add the 8090 port to the security group for Jenkins.
After changing the security group. change the below file port number.
Copycd /etc/default
sudo vi jenkins  #change 8080 to 8090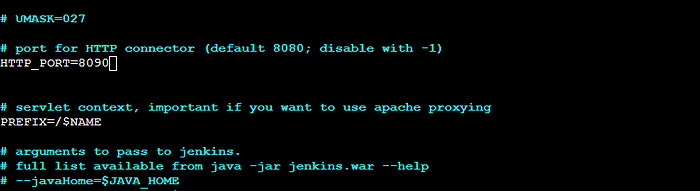
Copycd /lib/systemd/system
sudo vi jenkins.service
Replace the 8080 port in the Environment variable with 8090 and restart the jenkins server.
Copysudo systemctl daemon-reload
sudo systemctl restart jenkins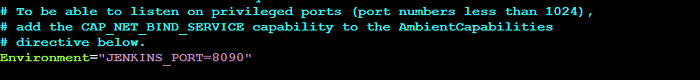
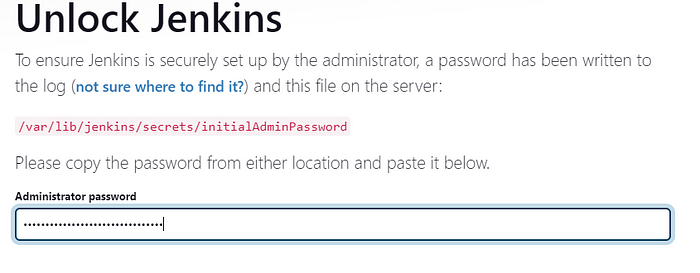
After the file setup, you can see the Jenkins Page at port 8090 by doing:
Copyhttp://<PUBLIC IP OF INSTANCE>:8090
sudo cat /var/lib/jenkins/secrets/initialAdminPassword
copy the above password in the unlock jenkins field.
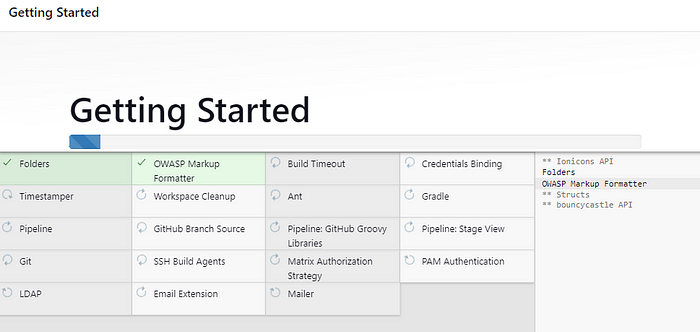
Install all the default plugins, We will install the tools plugin in the latter section of this blog. After giving the username and password select Next.
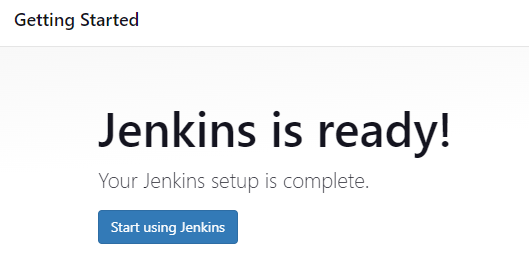
Jenkins Server is all set Let's set some other tools for our pipeline.
Before starting with the Installation let's know what SonarQube is used for in the DevSecOps pipeline. SonarQube is a system for managing the life of your website. It does this via automatic updates, monitoring, and small changes in code. These updates can be set so you don't have to worry about them again. SonarQube also alerts you when there are newer versions of your plugin available which will save you time when doing updates manually.
Its main feature is code Coverage and Code Quality which can check bugs, Vulnerability code smells, and Security Hotspots using custom or predefined Quality Gates and profiles. SonarQube comes with two versions Community and Developer.
We will be installing Docker for installing SonarQube in the container
Copysudo apt-get update
sudo apt-get install docker.io -y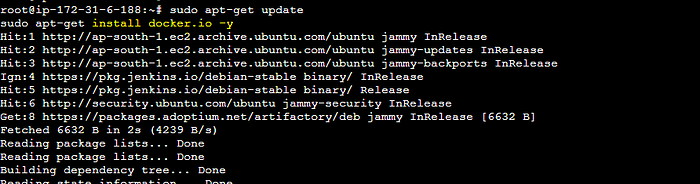
After this gran the Ubuntu user the permission to access Docker
Copysudo usermod -aG docker ubuntu
newgrp docker
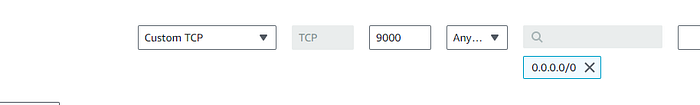
sudo chmod 777 /var/run/docker.sockAfter running the above command you can use the docker command successfully. Before starting with the SonarQube edit the security group for instance, CustomTCP with Port 9000 open, you can even restrict the access based on your authorized IPs.
Starting SonarQube container:
Copydocker run -d --name sonarqube-cont -p 9000:9000 sonarqube:lts-community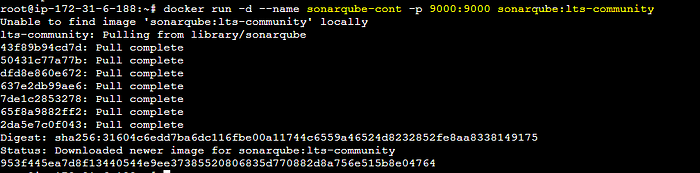
use the docker ps command to check the status of the running container.

Copy#To login
http://<PUBLIC-IP-OF-INSTANCE>:9000
Login the SonarQube using the default credentials
Copyusername: admin
password: admin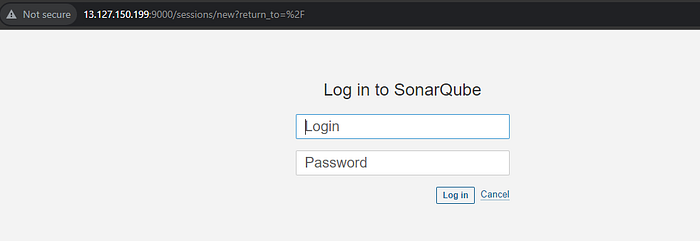
After Deafult login, You will be asked for the new SonarQube password. Give the password and click Save.SonarQube is all set let's install Trivy.
Trivy is a tool used for scanning Known vulnerabilities from IAC issues, misconfiguration, sensitive secrets, container images, software licenses, and even Kubernetes clusters. It generates a full report of all the vulnerabilities based on their severity. You can even sort or search for the vulnerability based on its severity.
You will install Trivy in the same instance as the Jenkins Server.
Copyvi trivy.sh
sudo apt-get install wget apt-transport-https gnupg lsb-release -y
wget -qO - https://aquasecurity.github.io/trivy-repo/deb/public.key | gpg --dearmor | sudo tee /usr/share/keyrings/trivy.gpg > /dev/null
echo "deb [signed-by=/usr/share/keyrings/trivy.gpg] https://aquasecurity.github.io/trivy-repo/deb $(lsb_release -sc) main" | sudo tee -a /etc/apt/sources.list.d/trivy.list
sudo apt-get update
sudo apt-get install trivy -y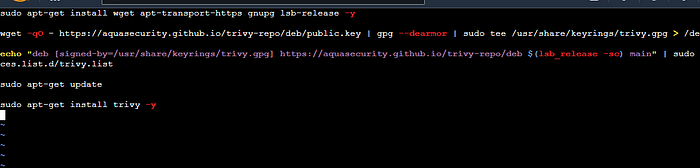
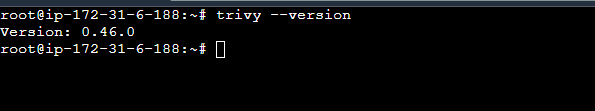
Check the Trivy Version and Trivy is all set.
After your SonarQube and Trivy setup, it is time to Configure the tools in Jenkins. We will go in steps now first installing plugins and then setting them up.
Step 1: Go to Manage Jenkins in the Jenkins Dashboard.
Step 2: Select Plugin from the option.
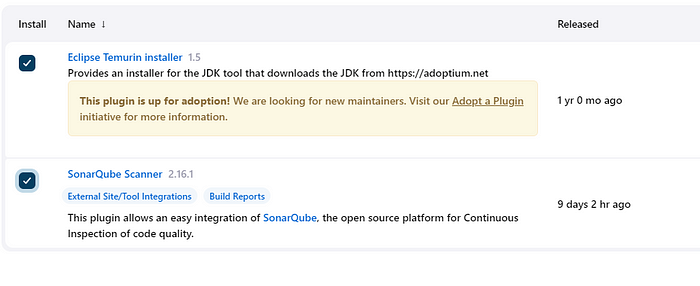
Step 3: Select Available plugins search for Eclipse Temurin Installer and SonarQube Scanner, and click on Install. (without restart)
Step 4: Set up Maven and jdk in the Global Tool section by choosing Tools in the Manage Jenkins.
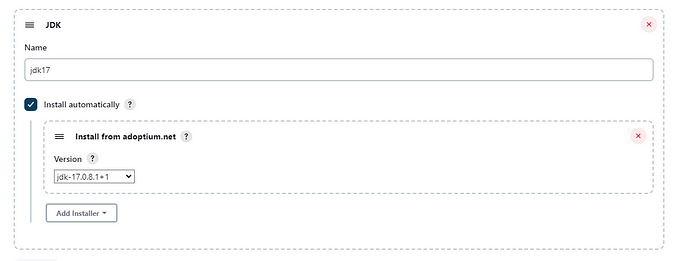
Step 5: Search for JDK and Maven boxes and fill the fields with the below details.
Maven
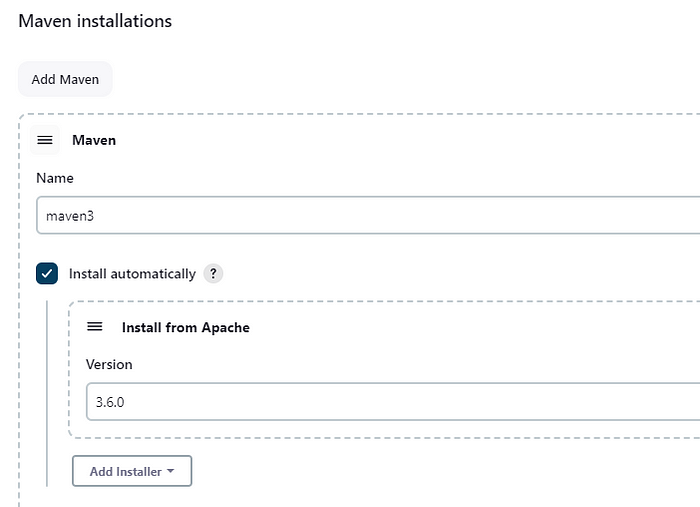
This will set up the JDK and Maven environment in jenkins. Let's Go create a Pipeline now.
In this Section, You will be creating the continuous integration pipeline which will fetch the code from GitHub and do further building and analysis in the code and Docker images.
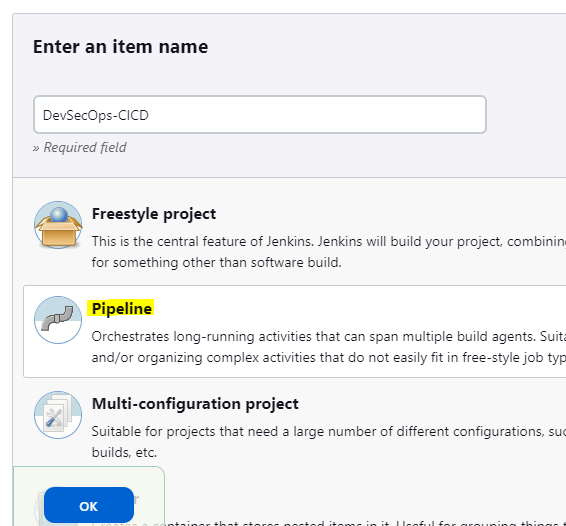
Step 1: Click on the New Item in the Jenkins Dashboard.
Step 2: Enter the item name and select pipeline as the project type.
In the pipeline Area, put the below code:
Copypipeline{
agent any
tools {
jdk 'jdk17'
maven 'maven3'
}
stages{
stage ('Cleaning Workspace'){
steps{
cleanWs()
}
}
stage ('checkout SCM') {
steps {
git 'https://github.com/priyanshu-bhatt/DevSecOps-CI-CD-Pipeline.git'
}
}
stage ('Compiling Maven Code') {
steps {
sh 'mvn clean compile'
}
}
stage ('maven Test') {
steps {
sh 'mvn test'
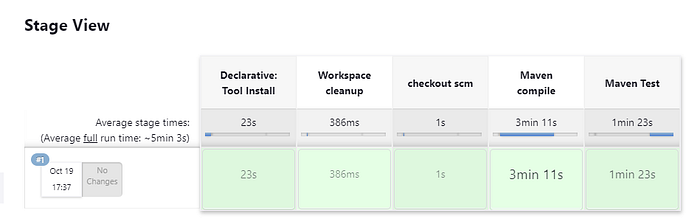
}In the above stages, we are cleaning the workspace, pulling the GitHub code in the jenkins Workspace, and using Maven to compile and test the code.
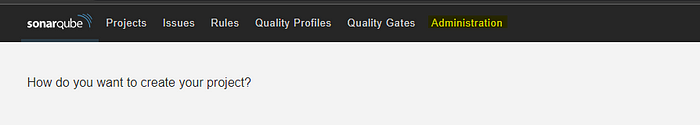
After this stage, we will set up the SonarQube to be integrated with Jenkins, Go to Server Url, and follow the below images.
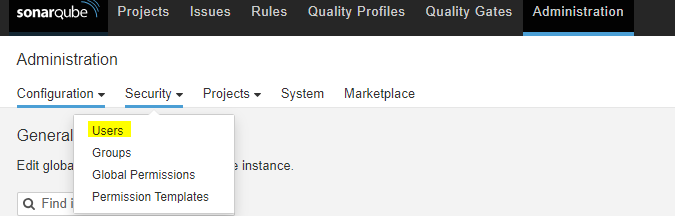
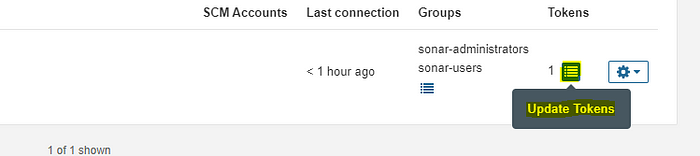
In the administration -> Users create a new token for jenkins usage.
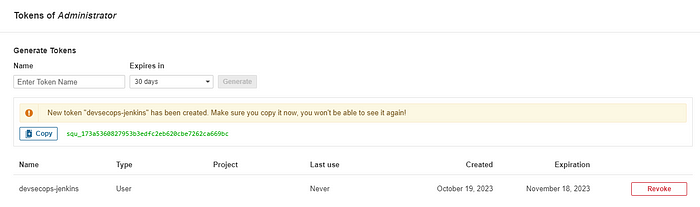
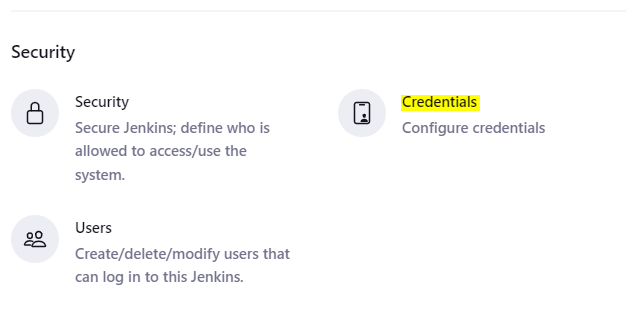
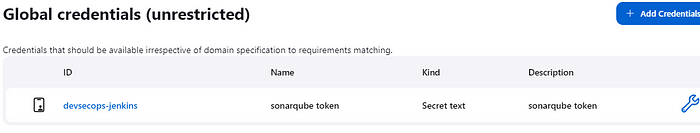
Copy the Unique credential for the token and go the the jenkins server URL. In the Jenkins Server URL, In Dashboard click manage Jenkins-> credentials and click on global.
Click on the Add Credentials, and fill in the details of the token in the dialogue box.
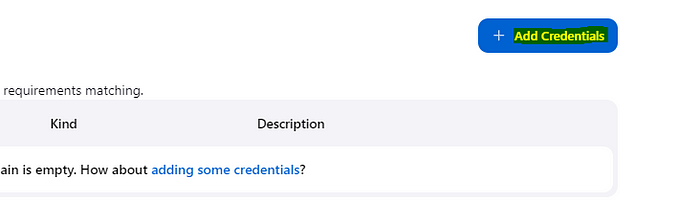
Choose kind as Secret Text and scope as Global. Put the copied unique code in the secret field, and add the ID and description to the token. Later this token will be used to authenticate to SonarQube Server.
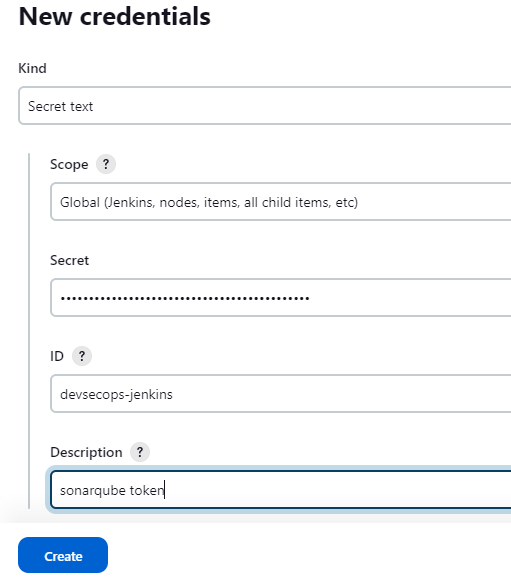
Click on Create to create the Token.
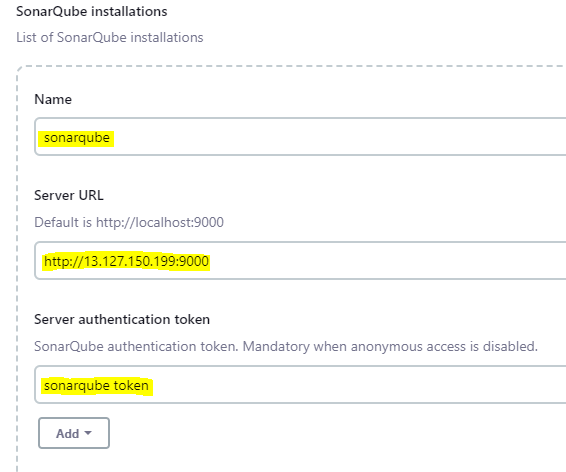
Now set up the SonarQube tool in the ManageJenkins -> Tools section and provide the SonarQube Url and Authentication token ID that we just created in jenkins Global Credentials.
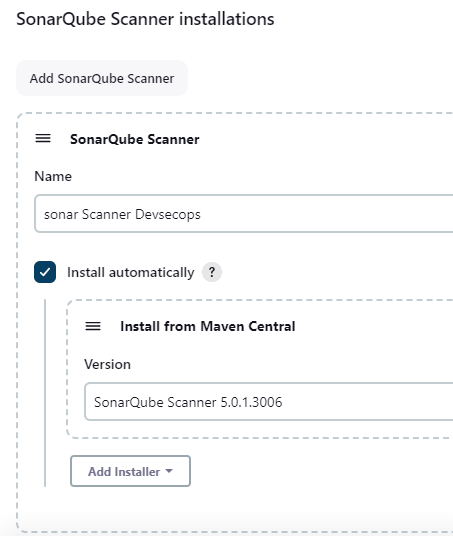
Set up the SonarQube scanner plugin installation in the Global Tools settings for easy SonarQube integration with Jenkins.
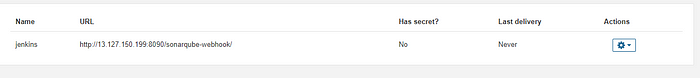
Set up the Webhook connection with SonarQube.In ***Administration -> Configuration -> WebHooks.***Webhooks in Sonarqube are used to tell the third Party(Jenkins) when the code analysis is complete.
Copyhttp://<JENKINS-IP:8090>/sonarqube-webhook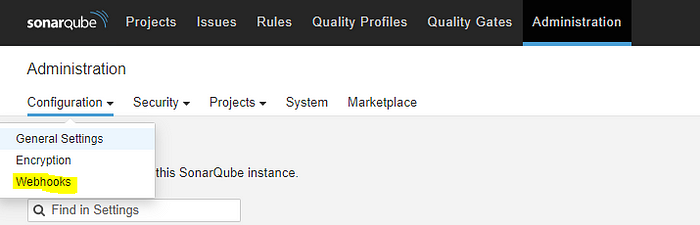
After all the pre-set-ups, Put the below code after the Maven Test stage for the SonarQube StageQuality Gate and Analysis. First Add the SCANNER_HOME environment block in the section below the tool.
Copyenvironment {
SCANNER_HOME=tool 'sonarqube'
}
stage("Sonarqube Analysis "){
steps{
withSonarQubeEnv('sonarqube') {
sh ''' $SCANNER_HOME/bin/sonar-scanner -Dsonar.projectName=Petshop \
-Dsonar.java.binaries=. \
-Dsonar.projectKey=Petshop '''
}
}
}
stage("quality gate"){
steps {
script {
waitForQualityGate abortPipeline: false, credentialsId: 'Sonarqube-token'
}
}
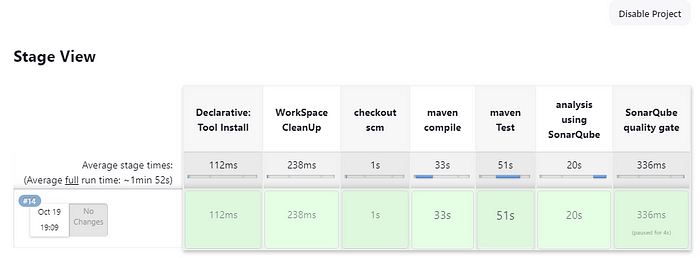
}In the SonarQube Analysis, we are proving the sonar server URL and credentials, The -Dsonar.java.binaries=. tells the SonarQube about the java binaries folder and Dsonar.projectKey=Petshop gives the project name for the SonarQube project. The Quality gate Stage waits for the Quality Gate checks and abortPipeline: false means that even if the quality check fails don't abort the pipeline. You can make it true for other projects if you want to abort the pipeline when the Quality Gate fails. The stage looks like this:
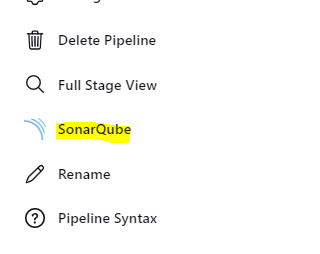
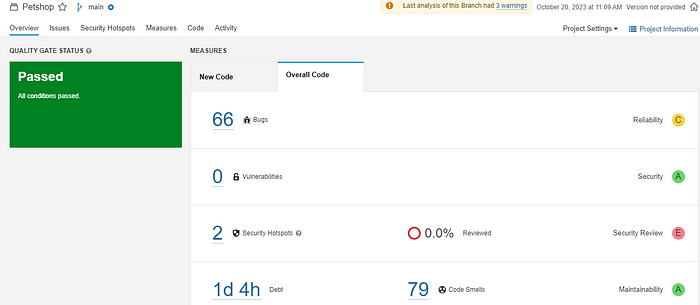
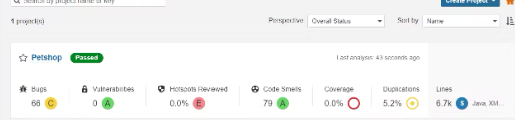
After the SonarQube Pipeline is successful you can see the SonarQube section in the left panel. Click on it to see the full report.
You can see that there are 66 bugs and 79 code smells(Badly written code) in the project. You can check the details in the issue tab. The Quality Gate shows passed which means the code analysis was successful by the defined gate rules. You can set the rules for custom use also. eg: Only pass if there are only 10 severe bugs and do code coverage of 90% code.
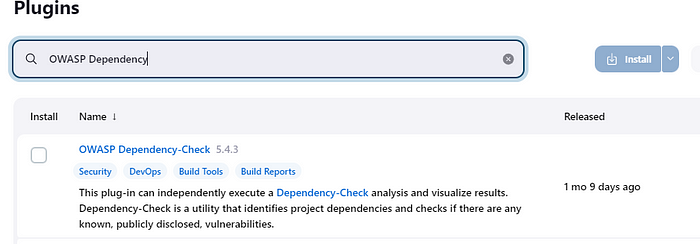
after setting up the SonarQube stage let's go with the OWASP Dependency Checker which is a software analysis tool used for analyzing and finding Vulnerabilities in the project. It collects the evidence in the form of the vendor, product, and version information.
In the Dashboard -> ManageJenkins -> Plugins install the OWASP Dependency Check.
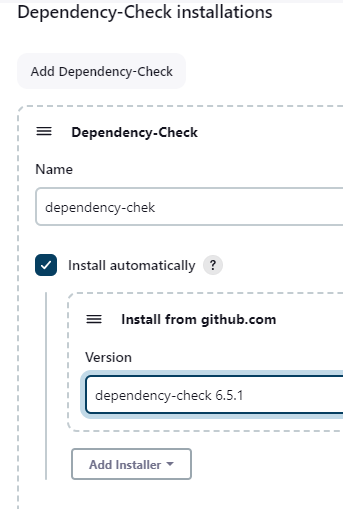
After installing the plugin set up the tool for the OWASP dependency checker in the global tools section.(Dashboard -> Tools)
Add the Dependency checker stage in the Jenkins file. configure -> pipeline*.*
Copy        stage ('Building war file using Maven'){
            steps{
                sh 'mvn clean install -DskipTests=true'
            }
        }
        stage("OWASP Dependency Checking"){
            steps{
                dependencyCheck additionalArguments: '--scan ./ --format XML ', odcInstallation: 'dependency-check'
                dependencyCheckPublisher pattern: '**/dependency-check-report.xml'
            }
        }
The Building stage cleans, builds, and installs the artifacts. OWASP Dependency stage scans the "." (current folder) and produces the report in the XML format,odcInstallation invokes the Dependency checker plugin. Now Build the pipeline.
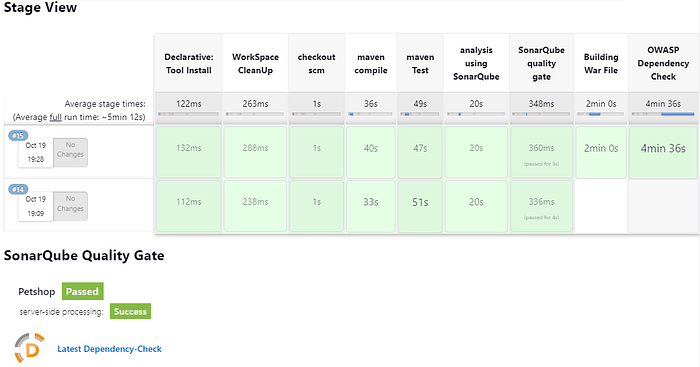
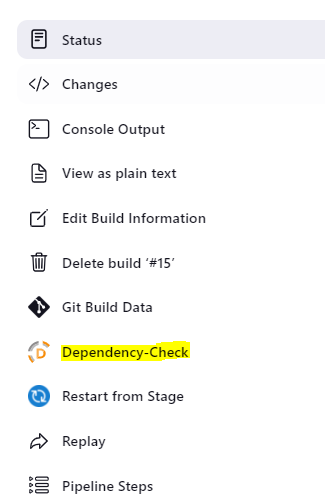
After the Build is successful you can see the Dependency check section in the left corner. You can click on it and check the dependency-related things.
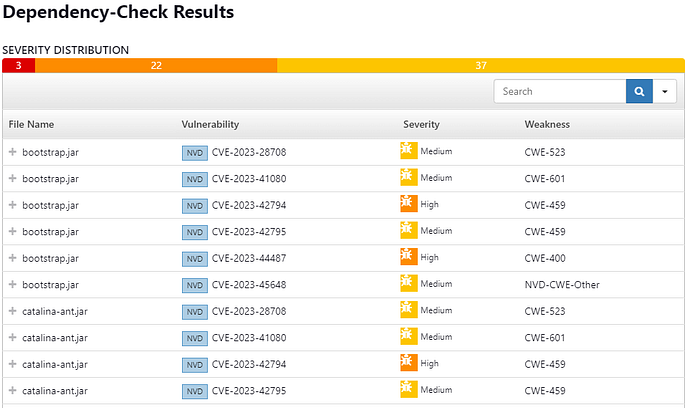
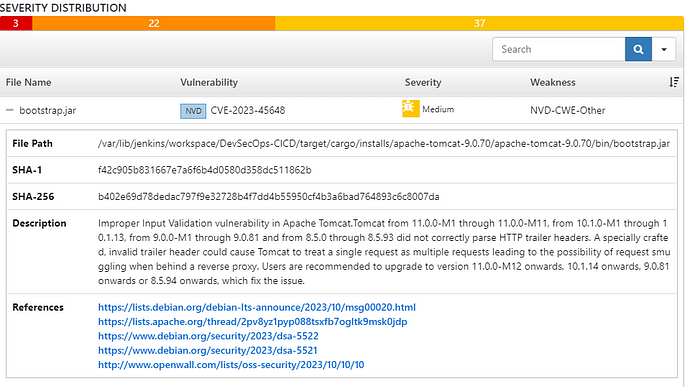
The screen shows the dependency vulnerabilities and the severity levels per file. On clicking on each issue you can check the details about the vulnerability.
It is not generally a good idea to use the jenkins server as the only instance where you install everything. You can check out my Docker slave blog for setting up the QA stage in that slave and the rest in the Jenkins server. For this project, I am just using the same Server for the QA stage But you can follow slave-based architecture too. As we are deploying a fully functional website with Database integrations and backend, In QA we are just concerned about whether the application is up or not, yes then the deployment(CD) pipeline will trigger if not then an Email will be sent to the QA team with the built details.
- Setting Up Docker Plugins:
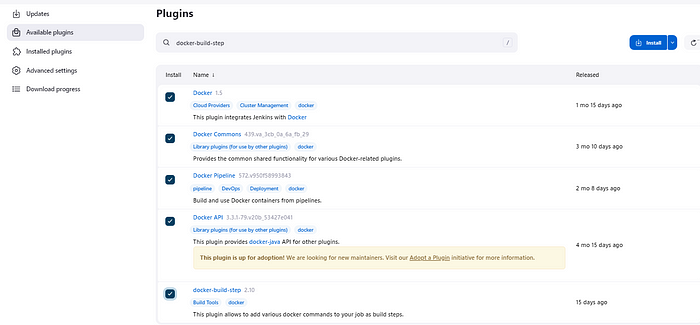
Install the same way we did above, Go to Dashboard -> Plugins -> Available plugins and install the below plugins:
Docker
Docker Pipeline
Docker API
Docker Commons
docker-build-step
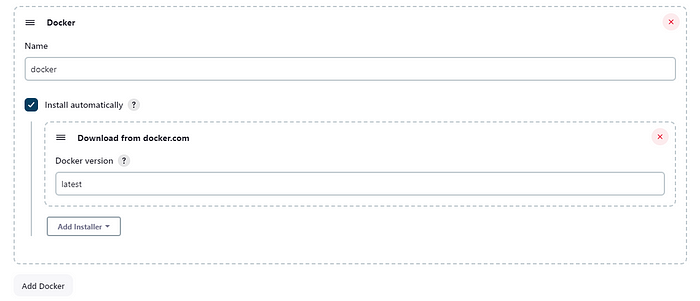
Go to Dashboard -> Tools and search for Docker. Add the docker configuration details in the fields.
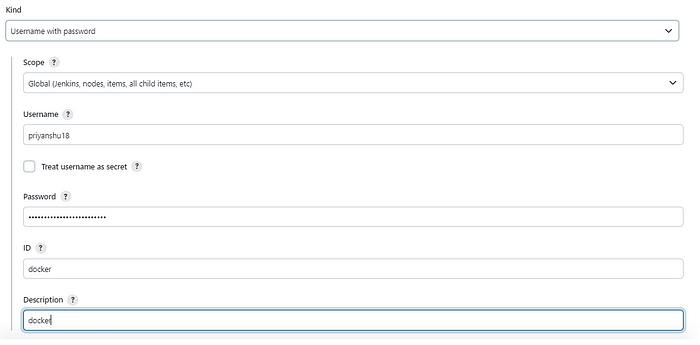
We want our build to be stored in a docker image and when we launch the environment for QA it should be in the docker container. So we will set up the credentials for the Dockerhub in the Jenkins Global Credential provider. Just copy and paste your username and password in there.
Now After all the setup, it's time to set up the next stage. Go to the Job -> Configure -> Pipeline section. Create this code for docker registry login using the pipeline syntax. (it's that simple!!)
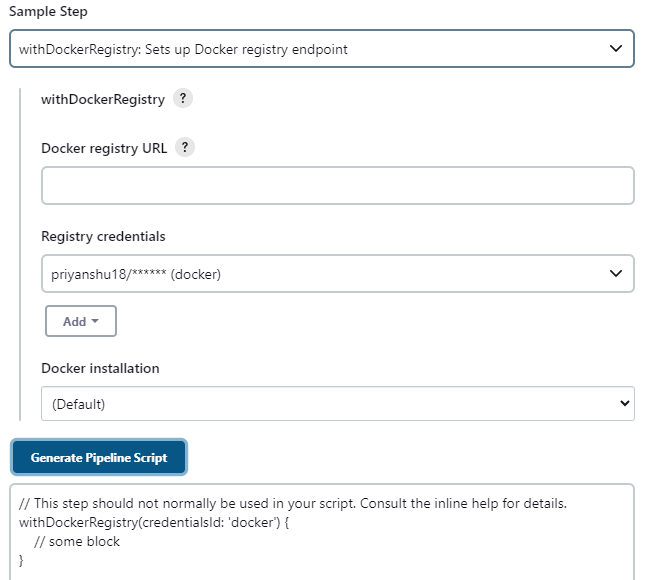
In this phase, we will also introduce the Trivy for container image analysis.
Copystage ('Building and pushing to docker hub'){
            steps{
                script{
                    withDockerRegistry(credentialsId: 'docker', toolName: 'docker') {
                        sh "docker build -t priyanshu18/petshop:${BUILD_TAG} ."
                        sh "docker push priyanshu18/petshop:${BUILD_TAG}"
                   }
                }
            }
        }
        stage("Image Scanning using TRIVY"){
            steps{
                sh "trivy image priyanshu18/petshop:${BUILD_TAG} > trivy.txt"
            }
        }
In the Build and Push stage build the Docker file and tags and push the image in the Dockerhub. The ${Build-tag} is used to create a version of the by image by putting the build number in the tags. The Trivy stage is used for the Image Analysis and stores the Analysis report as Trivy.txt.
Setting Up Mail service in Jenkins
Before moving ahead with the QA stage let's first configure the Mail service for notification purposes.
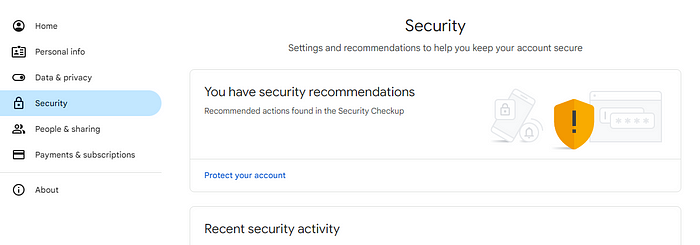
Step 1: Go to your Gmail Account -> Manage Account below your profile picture. In the landing page select Security Tab.
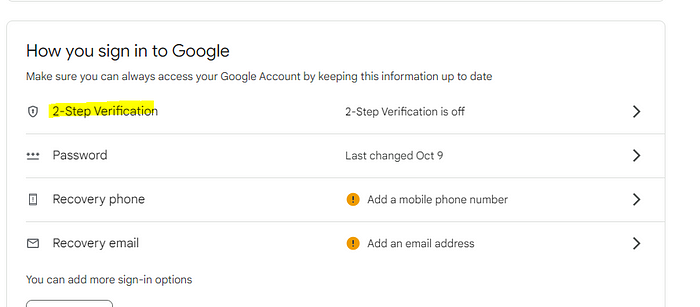
Step 2: Enable the 2-step Verification setting in your account, by simply providing your password and accepting the terms.
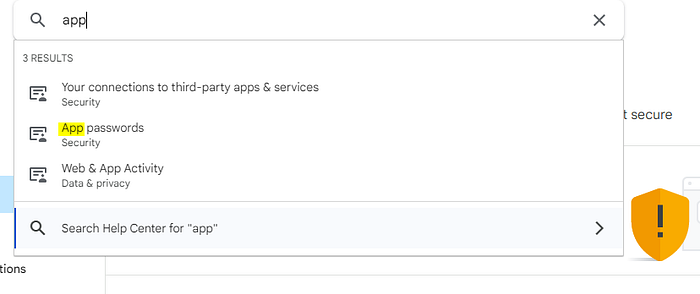
Step 3: In the search bar search app Passwords. An app password is a way through which you can integrate your Gmail with third-party applications. Follow the steps to get a unique password for your identity and copy it.
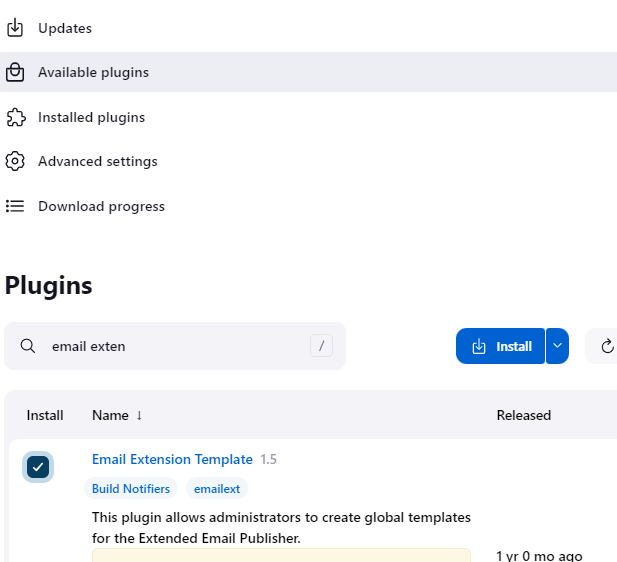
Now after setting up your Gmail settings. Go to Dashboard -> Manage Jenkins -> Plugins -> Available plugins and install email-extension-template plugins.
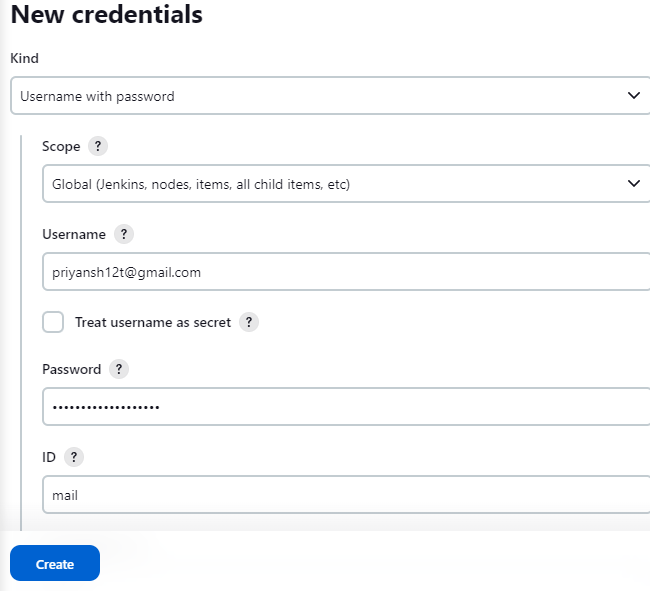
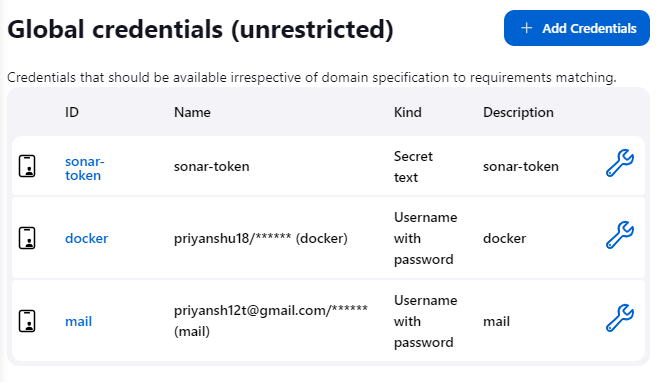
In the Dashboard -> Manage Jenkins -> Credentials -> Global -> Add credentials add the unique identity you just created above. Select username with password as the kind and fill in the username(your email) and password with the respective IDs.
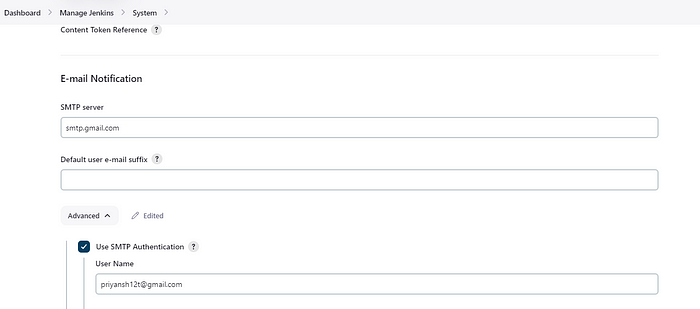
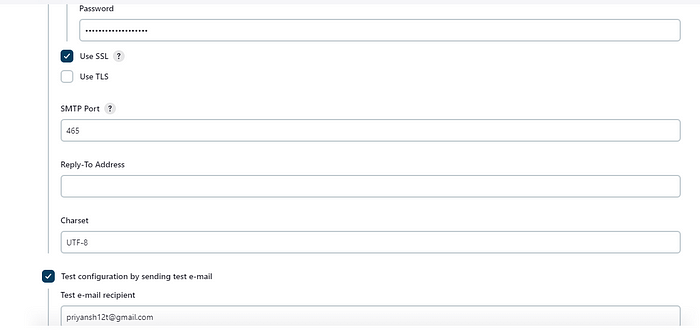
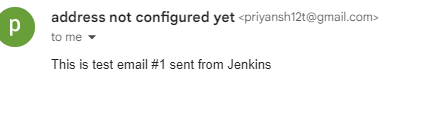
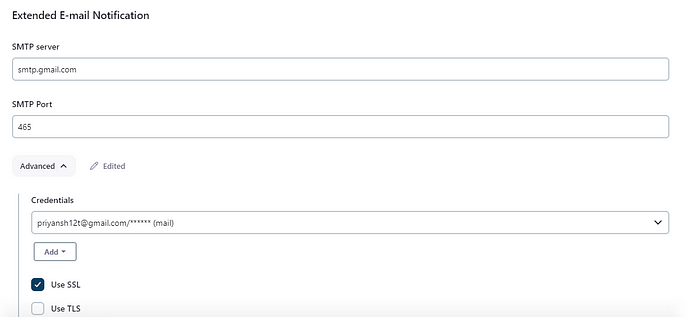
After setting up the credentials for your Gmail ID, add the configurations in the Email notification section in the ManageJenkins -> System. Add the SMTP server details and jenkins email credentials. Test your setup by sending a test email.
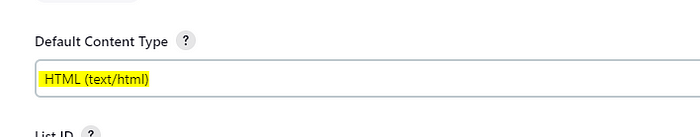
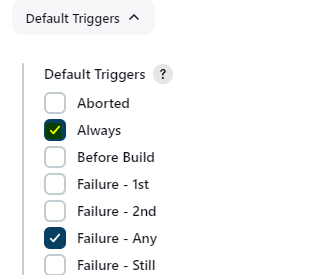
As the service configuration is good, now set up the extended email service notifications, This provides more customization in the emails. Add the below fields.
Now that our Container image and email service are all set we will create the QA stage:
Copystage('QA testing Stage'){
            steps{
                sh 'docker rm -f qacontainer'
                sh 'docker run -d --name qacontainer -p 8080:8080 priyanshu18/petshop:latest'
                sleep time: 60, unit: 'SECONDS'
                retry(10){

                sh 'curl --silent http://3.110.124.24:8080/jpetstore/ | grep JPetStore'
                }
                //testing curl

            }
            post {
                failure {
                    emailext attachLog: true,
                    subject: "'${currentBuild.result}'",
                    body: "Project: ${env.JOB_NAME}<br/>" +
                        "Build Number: ${env.BUILD_NUMBER}<br/>" +
                        "URL: ${env.BUILD_URL}<br/>"+
                        "<h1>QA Testing Failed</h1>",
                    to: 'qateam@gmail.com',
                    attachmentsPattern: 'trivy.txt'
                }
            }
        }
The QA testing stage runs the container with the recently pushed image and tests if it's up or not. As it is a heavy Java app it takes a bit of time to load hence You can use a sleep script to wait for 40–60 sec before trying to curl the endpoints.
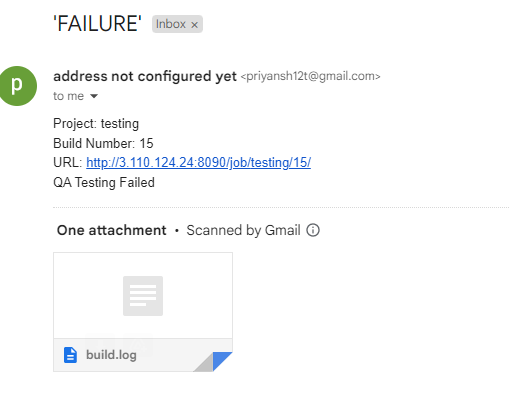
If the curl fails then the post block for failure will execute and it will notify the QA team about the issue and also attach the Trivy report and Build information for better Error analysis.
Build the stage and it will take about 15 min in the Building and pushing phase. After the QA test is successful it will trigger the Continuous Deployment Pipeline.
If it fails an email is send to the QA team:
After the CI(Continous Pipeline) the code will be all set for the Deployment. Here we will use Kubernetes for deployment as it provides more features and scalable architecture than simply using just Docker Containers.
Setting Up Kubernetes Cluster in AWS
Kubernetes, also called k8s is an open-source widely used container management and orchestration tool/platform that automates the deployment, management, and scaling of containerized applications.
Step 1: First install the Kubectl client in the jenkins server using a script.
Copysudo apt update
sudo apt install curl
curl -LO https://dl.k8s.io/release/$(curl -L -s https://dl.k8s.io/release/stable.txt)/bin/linux/amd64/kubectl
sudo install -o root -g root -m 0755 kubectl /usr/local/bin/kubectl
kubectl version --client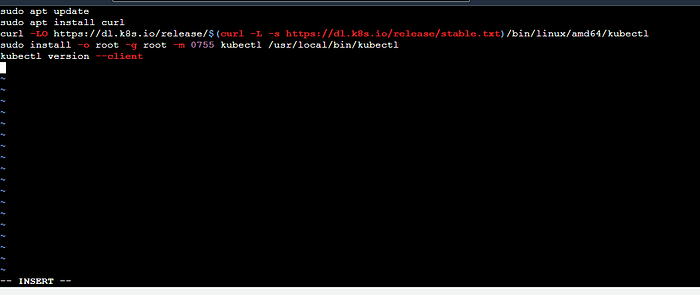
Copychmod 777 kubectl_install.sh
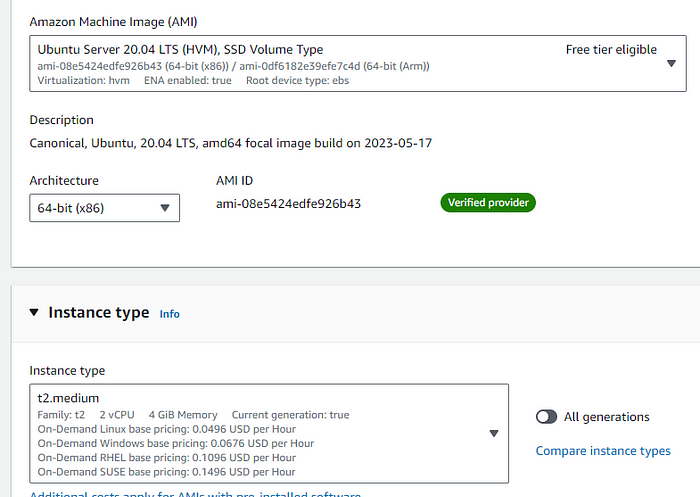
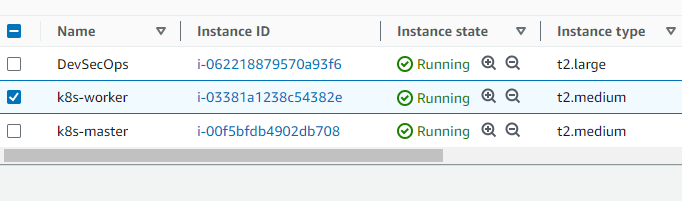
./kubectl_install.shStep 2: As we are creating a multi-node Kubernetes Cluster using Kubeadm we will create two Ubuntu(20.04) instances (master and slave) with a t2-medium instance type(not free) and the rest default settings.
Step 3: Run commands to set up the cluster in the master and attach the worker with the master using the join command. Run the below command in both master and worker.
Copysudo apt-get update
sudo apt-get install -y docker.io
sudo usermod –aG docker Ubuntu # giving permission to ubuntu user for docker
newgrp docker
sudo chmod 777 /var/run/docker.sock
sudo curl -s https://packages.cloud.google.com/apt/doc/apt-key.gpg | sudo apt-key add -
sudo tee /etc/apt/sources.list.d/kubernetes.list <<EOF
deb https://apt.kubernetes.io/ kubernetes-xenial main
EOF
sudo apt-get update
sudo apt-get install -y kubelet kubeadm kubectl # installing all the components
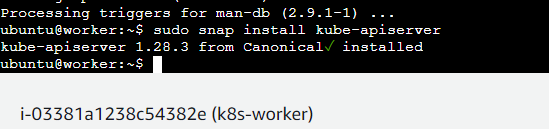
sudo snap install kube-apiserver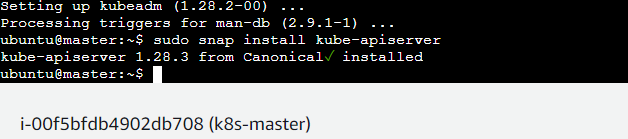
Step 4: After the above setup run the below command in the master
Copysudo kubeadm init --pod-network-cidr=10.244.0.0/16
# in case your in root exit from it and run below commands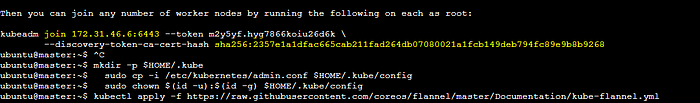
kubeadm init command will create the cluster and — pod-network-CIDR is the CIDR range for all the pods. You can change this range but make sure you also edit the flannel file cidr. init command if successful will give the below as the output. Run these commands in the non-root user(ubuntu).
Copymkdir -p $HOME/.kube
sudo cp -i /etc/kubernetes/admin.conf $HOME/.kube/config
sudo chown $(id -u):$(id -g) $HOME/.kube/config
After this for network connectivity run the CNI configuration command.
Copykubectl apply -f https://raw.githubusercontent.com/coreos/flannel/master/Documentation/kube-flannel.ymlOpen the 6443 port in the security group and Run the join command in the worker to join the cluster.
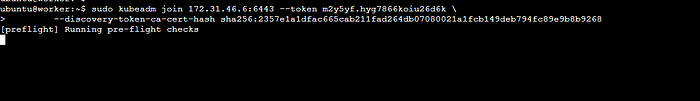
Copykubectl get nodes //to check the nodes in the cluster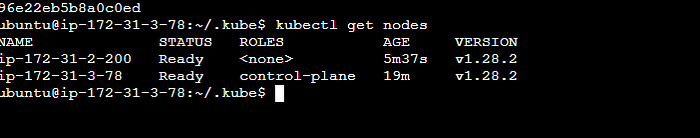
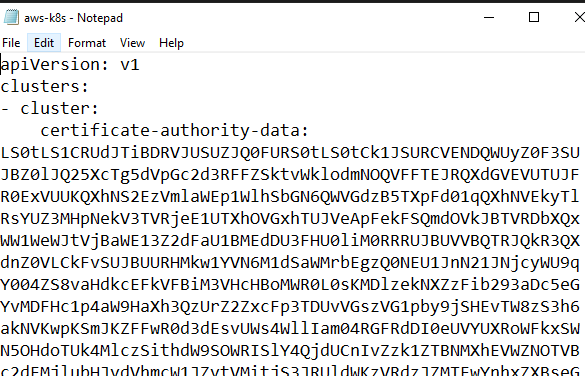
After this save the ./kube/config file(master), for jenkins integration with Kubernetes.
After setting up the Kubernetes Cluster it's time to setup the cluster in the Jenkins server.
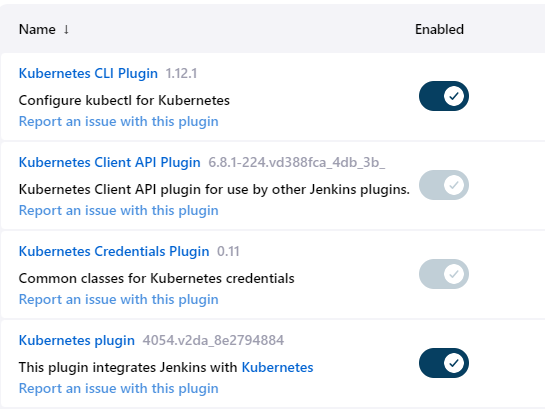
Step 1: Install the required kubernetes plugins:
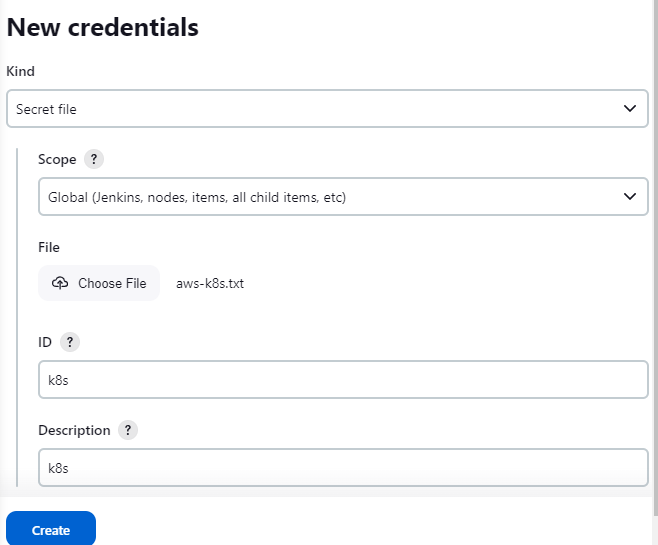
Step 2: Go to Dashboard -> Manage Jenkins -> Credentials -> Global and add the kubernetes cluster config file as the input for the kind secret file. Using this you can authenticate in the Api Server to run kubernetes command.
Step 3: Use Pipeline Syntax to generate code for the kube config cli integration.
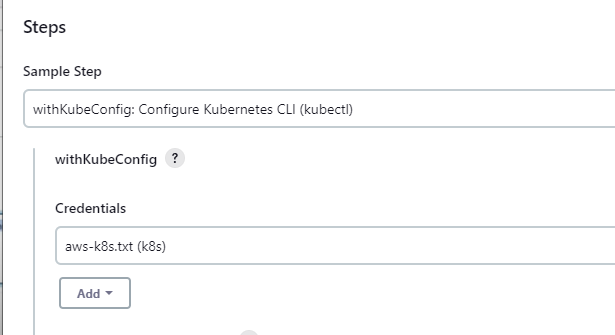
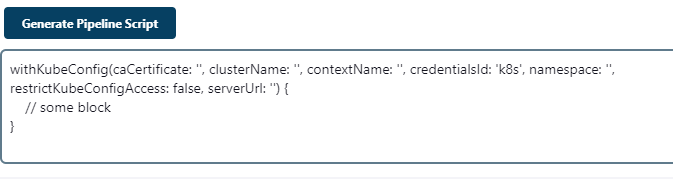
With all the above setup you're CD stage is all set, Add the below pipeline code in the pipeline section of the newly created CD pipeline(Dashboard ->New Item)
The below code cleans up the workspace and checkout SCM. The K8s stage uses the config file in the credentials to run the kubectl apply command in the kubernetes master. This creates a deployment, and pods are attached to the worker nodes as Master nodes are by default tainted. After the stage run successfully a post-stage block which will always send an email to the manager with the trivy report and build logs.
Copypipeline{
    agent any
    stages{
        stage ('WorkSpace CleanUp'){
            steps{
                cleanWs()
            }
        }
        stage ('checkout scm') {
            steps {
                git 'https://github.com/priyanshu-bhatt/DevSecOps-CI-CD-Pipeline.git'
            }
        }
        stage('K8s'){
            steps{
                script{
                    withKubeConfig(caCertificate: '', clusterName: '', contextName: '', credentialsId: 'k8s', namespace: '', restrictKubeConfigAccess: false, serverUrl: '') {
                        sh 'kubectl apply -f deployment.yaml'
                    }
                }
            }
    }
}
    post {
     always {
        emailext attachLog: true,
            subject: "'${currentBuild.result}'",
            body: "Project: ${env.JOB_NAME}<br/>" +
                "Build Number: ${env.BUILD_NUMBER}<br/>" +
                "URL: ${env.BUILD_URL}<br/>",
            to: 'priyansh12t@gmail.com',
            attachmentsPattern: 'trivy.txt'
        }
    }
}
To Trigger this CD Pipeline we need to add a trigger stage in the CI Pipeline. Add the below code in the CI Pipeline to trigger the CD Pipeline if the QA test stage runs successfully.
Copy//below QA test stage
stage("Trigger CD(Deployment)"){
steps{
// Trigger the deployment pipeline and wait for it to complete
build job: 'DevSecOps-CD', wait: true
}
}
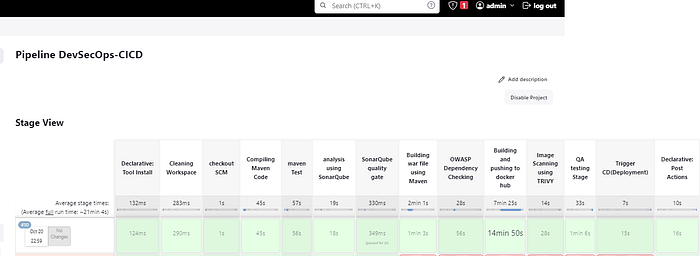
}Now with all the pipelines set and Ready, click on the build on the left of the CI Pipeline. After a few minutes, it will be a success, and you can see the email and page in the respective IDs and node Ip.
This is what the CI Pipeline looks like:
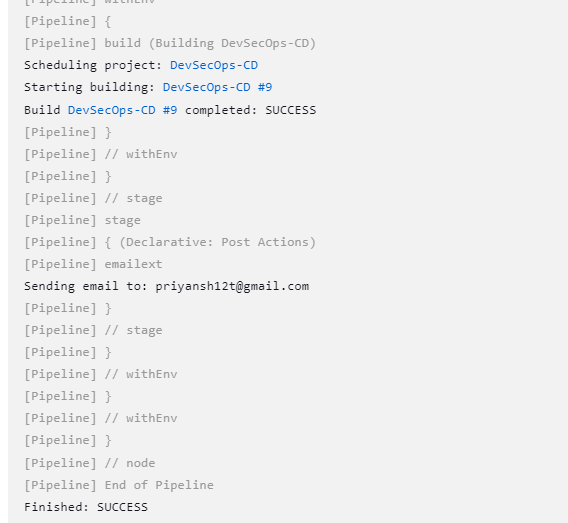
CD Pipeline:
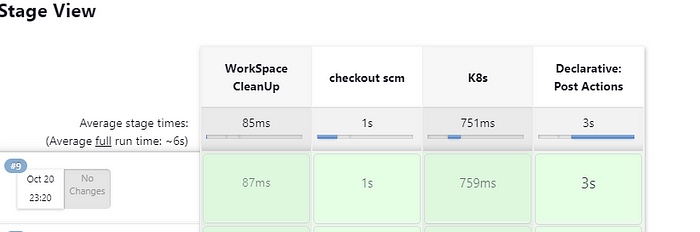
Shows that the CD stage is a success.
The below image shows that kubernetes deployment is successful as you can see in the output of the get command.
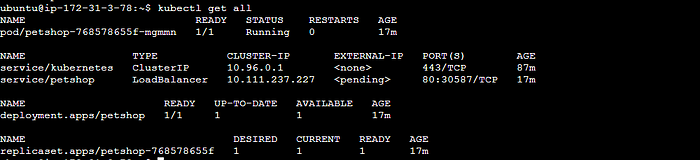
Copyhttp://<IP-of-NODE>:<service-port>/jpetstore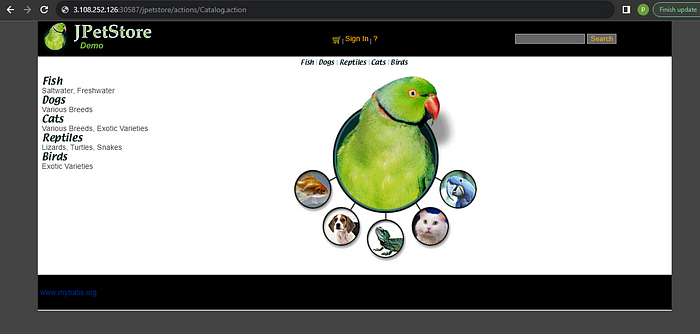
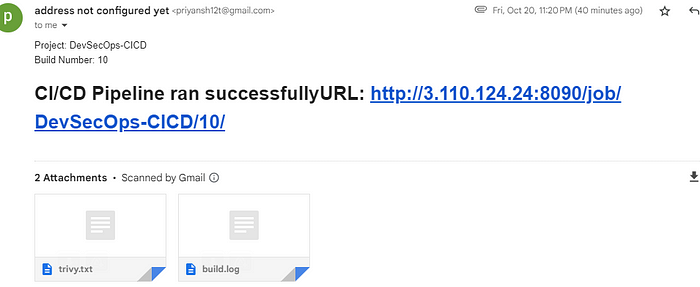
The below image shows the CI stage triggering Email notification as the post-stage block.
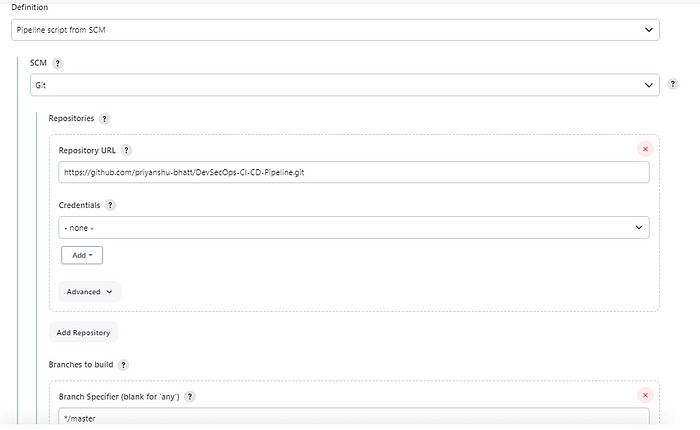
The hard stuff is over now, Let's set GitHub webhooks to automatically trigger the CI stage when there is a node code push in the repository. Go to Jenkins Dashboard in the pipeline section set Pipeline script from SCM and push your Jenkins file code in the GitHub, This automatically pulls the jenkins code and runs when webhooks will trigger.
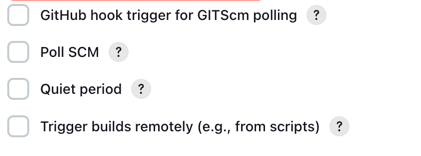
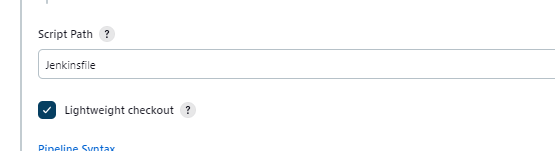
Add the repository and branch details in the fields, Add the jenkins file name in the script path. Click on the GitHub hook trigger for GitSCM pooling.
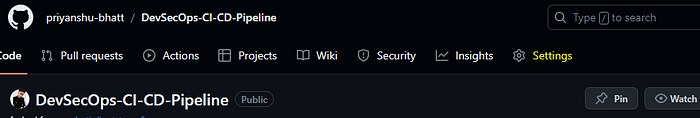
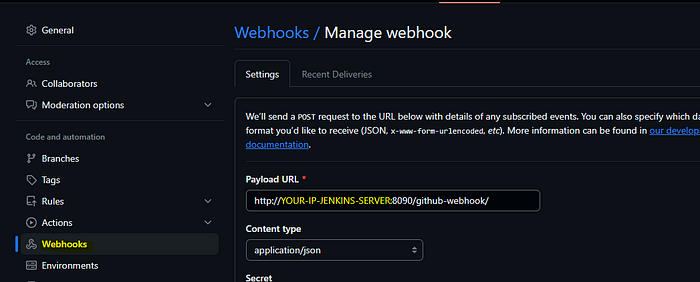
On the GitHub page for the respective repository. Click on the settings, then click on the webhooks. Add the Jenkins URL with /github-webhook/, select content as application/json, and send the payload by saving the webhook.
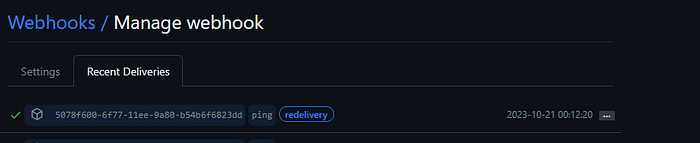
If the setup and the payload URL are correct you can see this in the recent deliveries.
Finally!!, we are done with all the components. Test the pipeline by pushing code in the GitHub and it will automatically trigger the CI/CD pipeline.
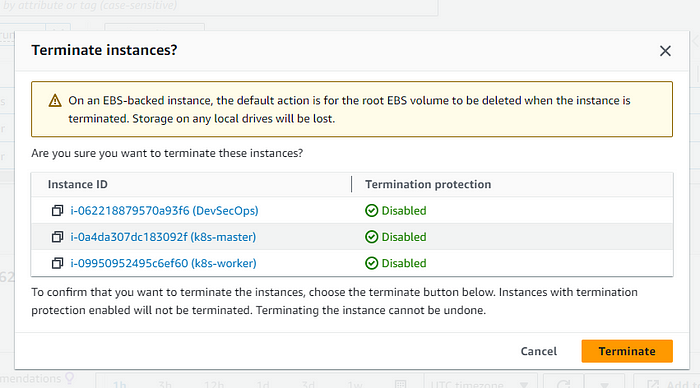
As we have used a lot of non-free compute services it's better to clean up the services by terminating the instance to prevent overcost.
That was the complete DevSecOps CI/CD pipeline from Scratch. If you want to integrate this Pipeline with IAC tools for Infrastructure and Configuration management.
This project is crafted by Harshhaa 💡.
I’d love to hear your feedback! Feel free to share your thoughts.
📧 Connect with me:
- GitHub: @NotHarshhaa
- Blog: ProDevOpsGuy
- Telegram Community: Join Here
If you found this helpful, consider starring ⭐ the repository and sharing it with your network! 🚀
