Case-00. US Bikeshare Data
- package:
- func:
Data: US Bikeshare Data (https://www.motivateco.com/use-our-data/)
Story: Comparing the system usage between three large cities: New York City, Chicago, and Washington, DC. What kinds of information would we want to know about in order to make smarter business decisions? If we were a user of the bike-share service, what factors might influence how we would want to use the service?
Investigation: Any differences within each system by those users that are registered, regular users VS short-term, casual users? It is possible that users who are subscribed to a bike-share system will have different patterns of use compared to users who only have temporary passes.
(Any other relationships? Where do bikers ride? When do they ride? How far do they go? Which stations are most popular? What days of the week are most rides taken on? Where are the most commonly used docks? What are the most common routes? Weather has potential to have a large impact on daily ridership? How much is ridership impacted when there is rain or snow? Are subscribers or customers affected more by changes in weather?)
-
package: csv, datetime, pprint
-
func:
datetime.date(),csv.DictReader(),csv.DictWriter(),.next(),.list(),.whiteheader(),.whiterow(),.strftime(%A),.replace(':','') -
issue: We obtain 3 csv files, but (a)The size of each dataset is too huge to get to the intuitive exploration.(b)There are inconsistencies. Each file has a different way of delivering its data. Even where the information is the same, the column names and formats are sometimes different (Chicago updates with new data twice a year, Washington DC is quarterly, and New York City is monthly).
-
approach: (a)Using DictReader object, starting off by looking at one row from each of the dataset.(b)Making sure that the data formats across the cities are consistent, and trimming focusing only on the parts of the data we are most interested in - 1)trip duration, 2)starting month, 3)starting hour, 4)day of the week, and 5)user type.
-
columns to extract from :
- Duration: Given to us in seconds (New York, Chicago) or milliseconds (Washington). Need to be given in terms of minutes.
- Month, Hour, Day of Week: Ridership volume is likely to change based on the season, time of day, and whether it is a weekday or weekend. We use the start time of the trip to obtain these values. The New York City data includes the seconds in their timestamps, while Washington and Chicago do not.
- User Type: Washington divides its users into two types: 'Registered'(annual, monthly) and 'Casual'(24-hour, 3-day, other short-term passes). The New York and Chicago data uses 'Subscriber' and 'Customer' for these groups, respectively. For consistency, we convert the Washington labels to match the other two. There are some missing 'user-type' values in the New York city dataset. Since we don't have enough information to fill these values in, we leave them as-is.
-
[CODE]
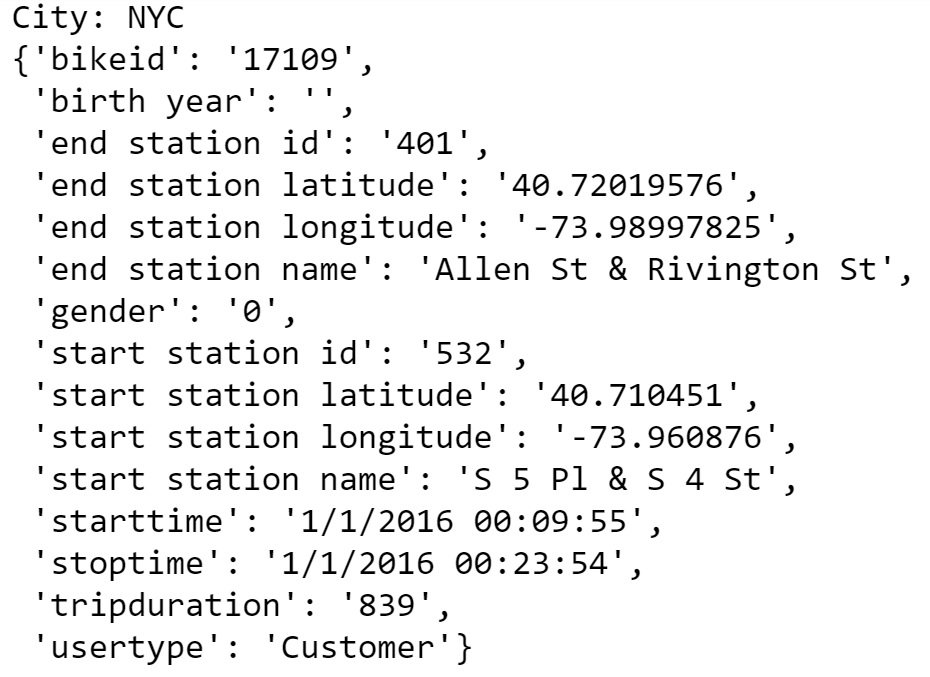
Planning_01.(Data Collecting): Define a function that prints the name of the city and returns(extracts) the 'first data point'(second row) from the large csv files (DictReader object) that includes a 'header row'. It prints the city names and the first data point to check now so that the first trip is parsed in the form of a dictionary. And it also returns those values to use when we create a 'dictionary-nesting dictionary' later on....which is important because it's a provided data file to iterate through later.
- DictReader object: When we set up a DictReader object, the first row of the data file is normally interpreted as column names. Every other row in the data file will use those column names as keys, as a dictionary is generated for each row.
- next(): Return the next row of the reader’s iterable object as a list
- pprint():
def print_first_point(filename):
    city = filename.split('-')[2].split('/')[-1]
    print('\nCity: {}'.format(city))

    with open(filename, 'r') as f_in:
        trip_reader = csv.DictReader(f_in)
        first_trip = next(trip_reader)
        pprint(first_trip)
    return (city, first_trip)

#testing------------------------------------------------------------------------------------------------------------
data_files = ['C:/Users/Minkun/Desktop/classes_1/NanoDeg/1.Data_AN/L2/bike-share-analysis/data/NYC-CitiBike-2016.csv',
              'C:/Users/Minkun/Desktop/classes_1/NanoDeg/1.Data_AN/L2/bike-share-analysis/data/Chicago-Divvy-2016.csv',
              'C:/Users/Minkun/Desktop/classes_1/NanoDeg/1.Data_AN/L2/bike-share-analysis/data/Washington-CapitalBikeshare-2016.csv',]

example_trips = {} ###there we go!###
for i in data_files:
    ct, ftrip = print_first_point(i)
    example_trips[ct] = ftrip

example_trips['NYC']['tripduration']
example_trips['Washington']['user_type']
example_trips['Chicago']['starttime']

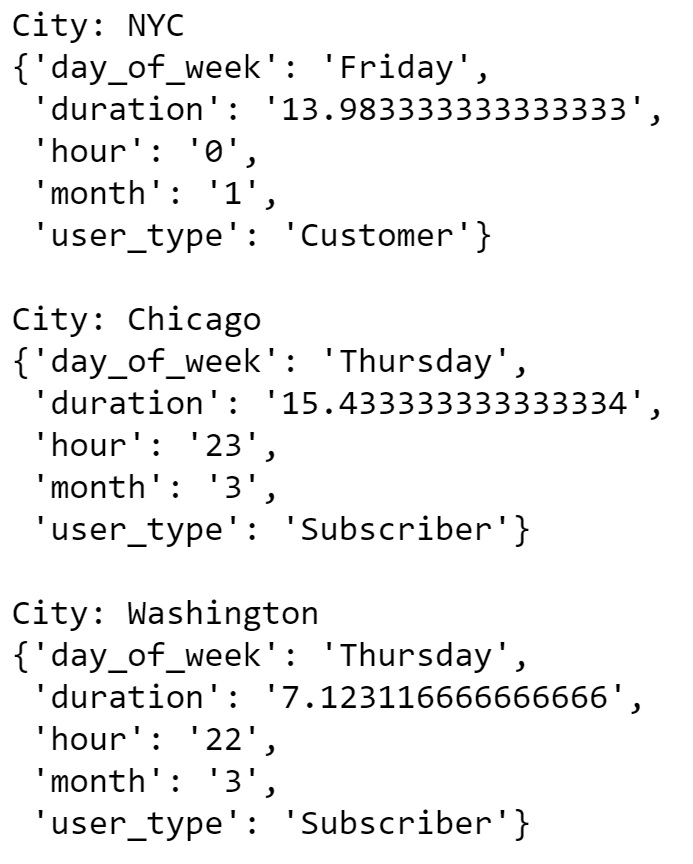
Planning_02.(Data Condensing): It is observable from the above printout that each city provides different information. We want a bundle of functions that generate new data files with the five columns of interest for each trip - 1)trip duration, 2)starting month, starting hour, day of the week, 3)user type - and a single condensing function that produces a final dictionary that consists of the extracted new data files.
- func_01. duration_in_min(datum, city) :Takes as input a "dictionary" containing info about a single trip (datum) and its origin city (city) and returns the trip duration in units of minutes.
- func_02. time_of_trip(datum, city) :Takes as input a dictionary containing info about a single trip (datum) and its origin city (city) and returns the month, hour, and day of the week in which the trip was made.
- func_03. type_of_user(datum, city) :Takes as input a "dictionary" containing info about a single trip (datum) and its origin city (city) and returns the type of system user that made the trip.
- func_04. condense_data(in_file, out_file, city) :Takes full data from the specified input file and writes the condensed data to a specified output file. The city argument determines how the input file will be parsed.
- The csv module reads in all of the data as strings, including numeric values. We will need a function to convert the strings into an appropriate numeric type when making transformations.
def duration_in_mins(datum, city):
    if city=='Washington':
        dura_value = float(datum['Duration (ms)'])/60000
    else:
        dura_value = float(datum['tripduration'])/60
    return dura_value


def time_of_trip(datum, city):
    if city=='Washington':
        month,day,year = (int(x.replace(':','')) for x in datum['Start date'].split()[0].split('/'))
        hour = int(datum['Start date'].split()[-1][:2].replace(':',''))
        ans = datetime.date(year, month, day)
        day_of_week = ans.strftime('%A')
    else:
        month,day,year = (int(x.replace(':','')) for x in datum['starttime'].split()[0].split('/'))
        hour = int(datum['starttime'].split()[-1][:2].replace(':',''))
        ans = datetime.date(year, month, day)
        day_of_week = ans.strftime('%A')
    return (month, hour, day_of_week)


def type_of_user(datum, city):
    if city == 'Washington':
        if datum['Member Type']=='Registered':
            user_type = 'Subscriber'
        else:
            user_type = 'Customer'
    else:
        user_type = datum['usertype']
    return user_type


def condense_data(in_file, out_file, city):
    with open(out_file, 'w') as f_out, open(in_file, 'r') as f_in:
        trip_writer = csv.DictWriter(f_out, fieldnames = ['duration', 'month', 'hour', 'day_of_week', 'user_type'])
        trip_writer.writeheader()
        trip_reader = csv.DictReader(f_in)

        for row in trip_reader:
            new_point = {}
            new_point['duration'] = duration_in_mins(row, city)
            new_point['month'] = time_of_trip(row, city)[0]
            new_point['hour'] = time_of_trip(row, city)[1]
            new_point['day_of_week'] = time_of_trip(row, city)[2]
            new_point['user_type'] = type_of_user(row, city)
            trip_writer.writerow(new_point)

city_info = {'Washington': {'in_file': 'C:/Users/Minkun/Desktop/classes_1/NanoDeg/1.Data_AN/L2/bike-share-analysis/data/Washington-CapitalBikeshare-2016.csv',
                            'out_file': 'C:/Users/Minkun/Desktop/classes_1/NanoDeg/1.Data_AN/L2/bike-share-analysis/data/Washington-2016-Summary.csv'},
             'Chicago': {'in_file': 'C:/Users/Minkun/Desktop/classes_1/NanoDeg/1.Data_AN/L2/bike-share-analysis/data/Chicago-Divvy-2016.csv',
                         'out_file': 'C:/Users/Minkun/Desktop/classes_1/NanoDeg/1.Data_AN/L2/bike-share-analysis/data/Chicago-2016-Summary.csv'},
             'NYC': {'in_file': 'C:/Users/Minkun/Desktop/classes_1/NanoDeg/1.Data_AN/L2/bike-share-analysis/data/NYC-CitiBike-2016.csv',
                     'out_file': 'C:/Users/Minkun/Desktop/classes_1/NanoDeg/1.Data_AN/L2/bike-share-analysis/data/NYC-2016-Summary.csv'}}

for city, filenames in city_info.items():
    condense_data(filenames['in_file'], filenames['out_file'], city)
    print_first_point(filenames['out_file'])
-
package: matplotlib
-
func:
plt.hist(data, bins = range(,,)),plt.title('str: {}'.format(i)),plt.xlabel('str'),plt.show() -
[CODE]
-
question: Altough We don't have the dictinary with full entries, can we create some |SUMMARIES| using DictReader object? Which city has the highest number of trips? Which city has the highest proportion of trips made by subscribers? Which city has the highest proportion of trips made by short-term customers?
-
func_01. number_of_trips(filename) :Define a function that reads in a file with trip data and reports the number of trips made by subscribers, customers, and total overall.
data_file= {'Washington': 'C:/Users/Minkun/Desktop/classes_1/NanoDeg/1.Data_AN/L2/bike-share-analysis/data/Washington-2016-Summary.csv',
            'Chicago': 'C:/Users/Minkun/Desktop/classes_1/NanoDeg/1.Data_AN/L2/bike-share-analysis/data/Chicago-2016-Summary.csv',
            'NYC': 'C:/Users/Minkun/Desktop/classes_1/NanoDeg/1.Data_AN/L2/bike-share-analysis/data/NYC-2016-Summary.csv'}

def number_of_trips(filename):
    with open(filename, 'r') as f_in:
        reader = csv.DictReader(f_in)

        n_subscribers = 0
        n_customers = 0

        for row in reader:
            if row['user_type'] == 'Subscriber':
                n_subscribers += 1
            elif row['user_type'] == 'Customer':
                n_customers += 1
        n_total = n_subscribers + n_customers

        return(n_subscribers, n_customers, n_total, n_subscribers/n_total, n_customers/n_total)

for i in data_file:
    print(i, number_of_trips(data_file[i]))

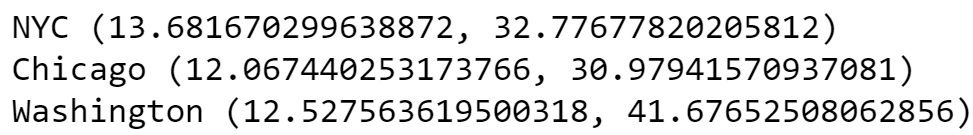
- question: Bike-share systems are designed for riders to take short trips. Most of the time, users are allowed to take trips of 30 minutes or less with no additional charges, with overage charges made for trips of longer than that duration. What is the average trip length for each city? What proportion of rides made in each city are longer than 30 minutes?
- func_01. avg_trip_len(filename) :Define a function that reads in a file with trip data and reports the average trip length and proportion of rides longer than 30 minutes.
def avg_trip_len(filename):
    with open(filename, 'r') as f_in:
        reader = csv.DictReader(f_in)
        x = []
        for row in reader:
            x.append(int(round(float(row['duration'].replace(':','')))))
        avg = sum(x)/len(x)

        n = 0
        for i in x:
            if i>=30:
                n+=1
            else:
                n+=0
        over = (n/len(x))*100

        return(avg, over)

for i in data_file:
    print(i, avg_trip_len(data_file[i]))
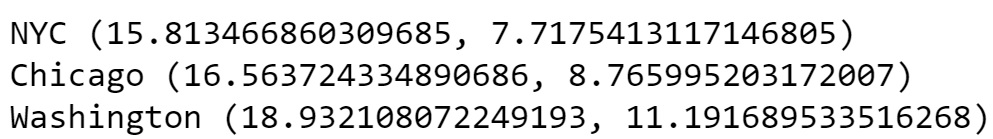
- question: Dig deeper into the question of trip duration based on ridership. Choose one city. Within that city, which type of user takes longer rides on average: Subscribers or Customers?
- func_01. pivot(filename) :Define a function that reads in a file with trip data and reports the average trip length by Subscribers and Customers.
def pivot(filename):
    with open(filename, 'r') as f_in:
        reader = csv.DictReader(f_in)
        s = []
        c = []
        for row in reader:
            if row['user_type']=='Subscriber':
                s.append(int(round(float(row['duration'].replace(':','')))))
            else:
                c.append(int(round(float(row['duration'].replace(':','')))))
        return (sum(s)/len(s), sum(c)/len(c))

for i in data_file:
    print(i, pivot(data_file[i]))
- ##plotting##
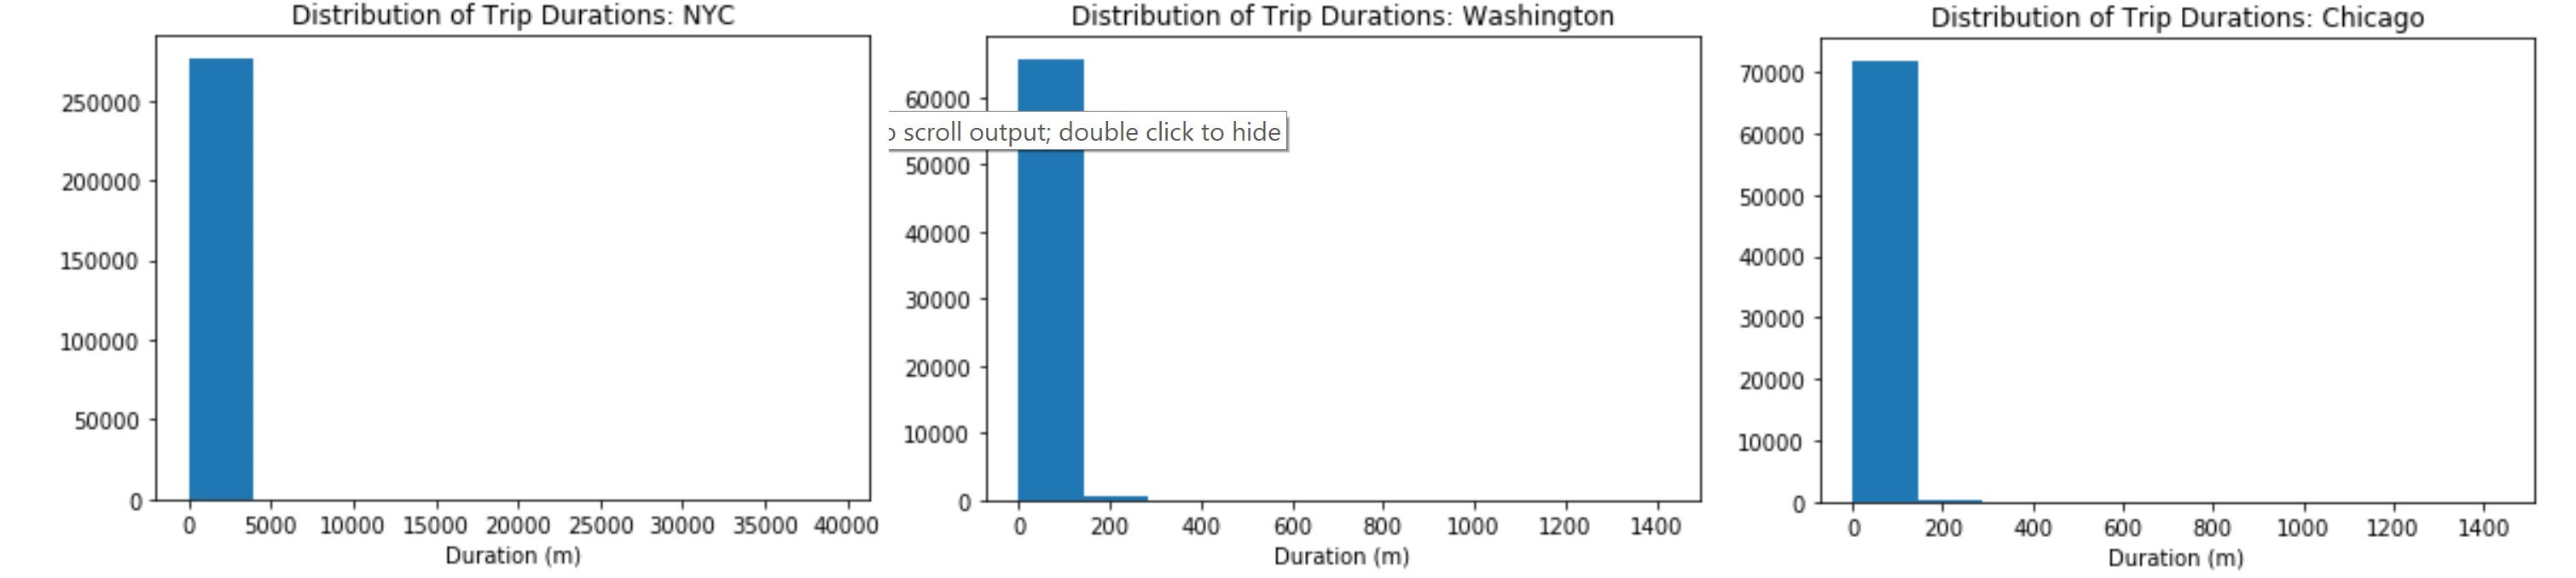
- question: The output has pulled up an interesting result. While the mean trip time for Subscribers is well under 30 minutes, the mean trip time for Customers is actually above 30 minutes! It will be interesting for us to look at how the trip times are distributed.
- func_01. triplist(filename) :Define a function returning a simple list (not df) then you create a histogram of the trip times for the city - NYC, Washington, Chicago
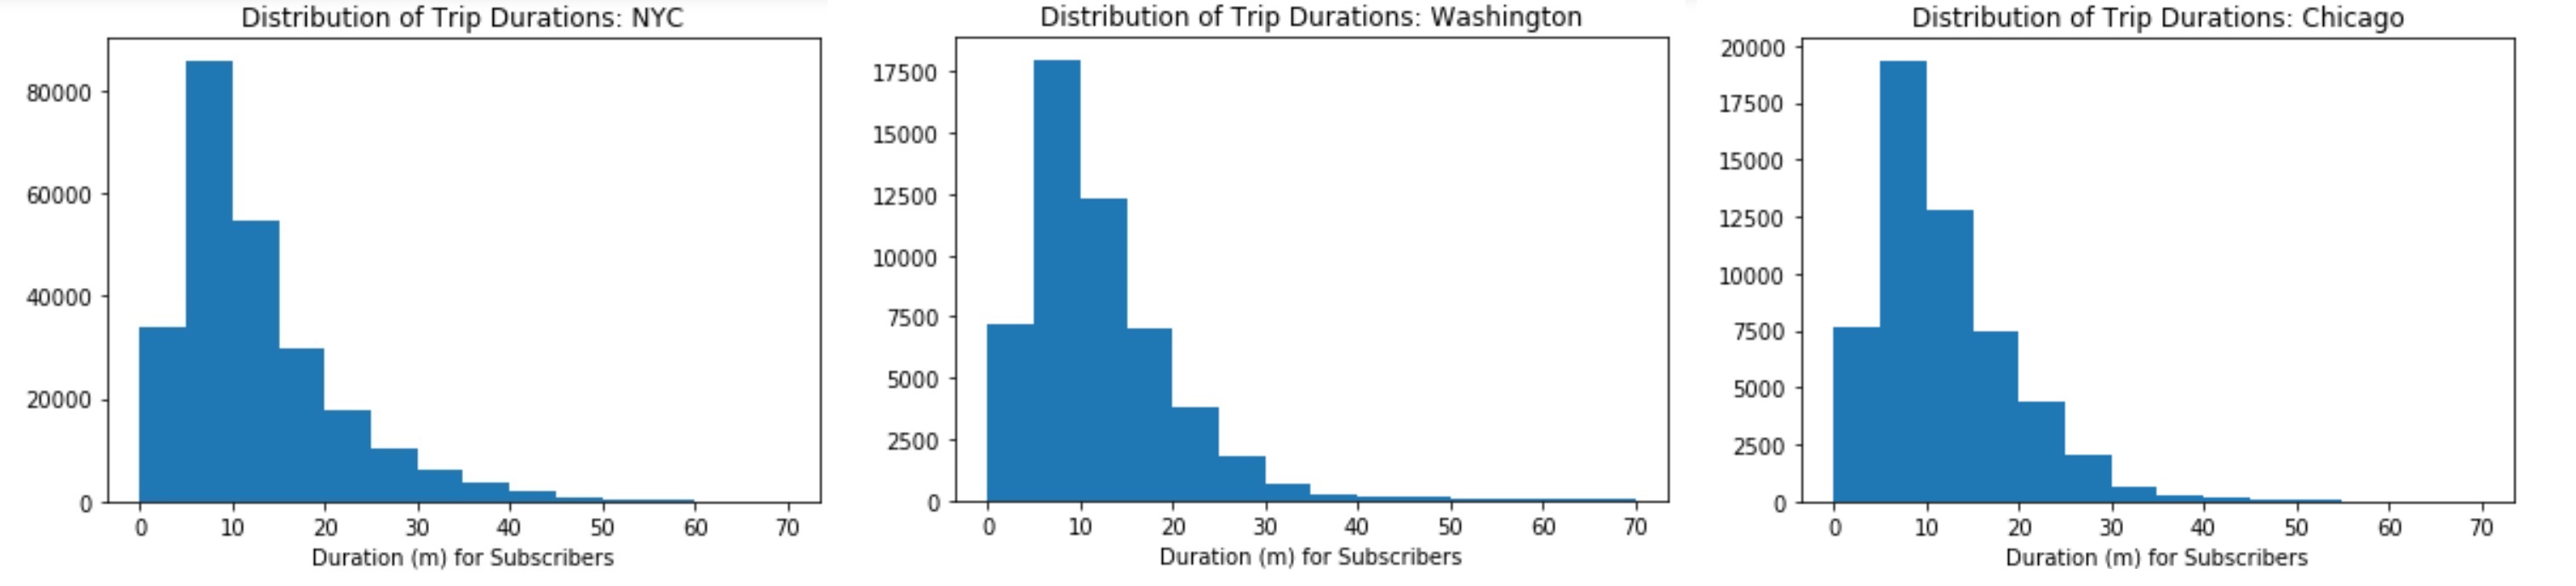
- func_02. triplist_s(filename) :Define a function returning a simple list (not df) then you create a histogram of the trip times for the city (only for Subscribers)
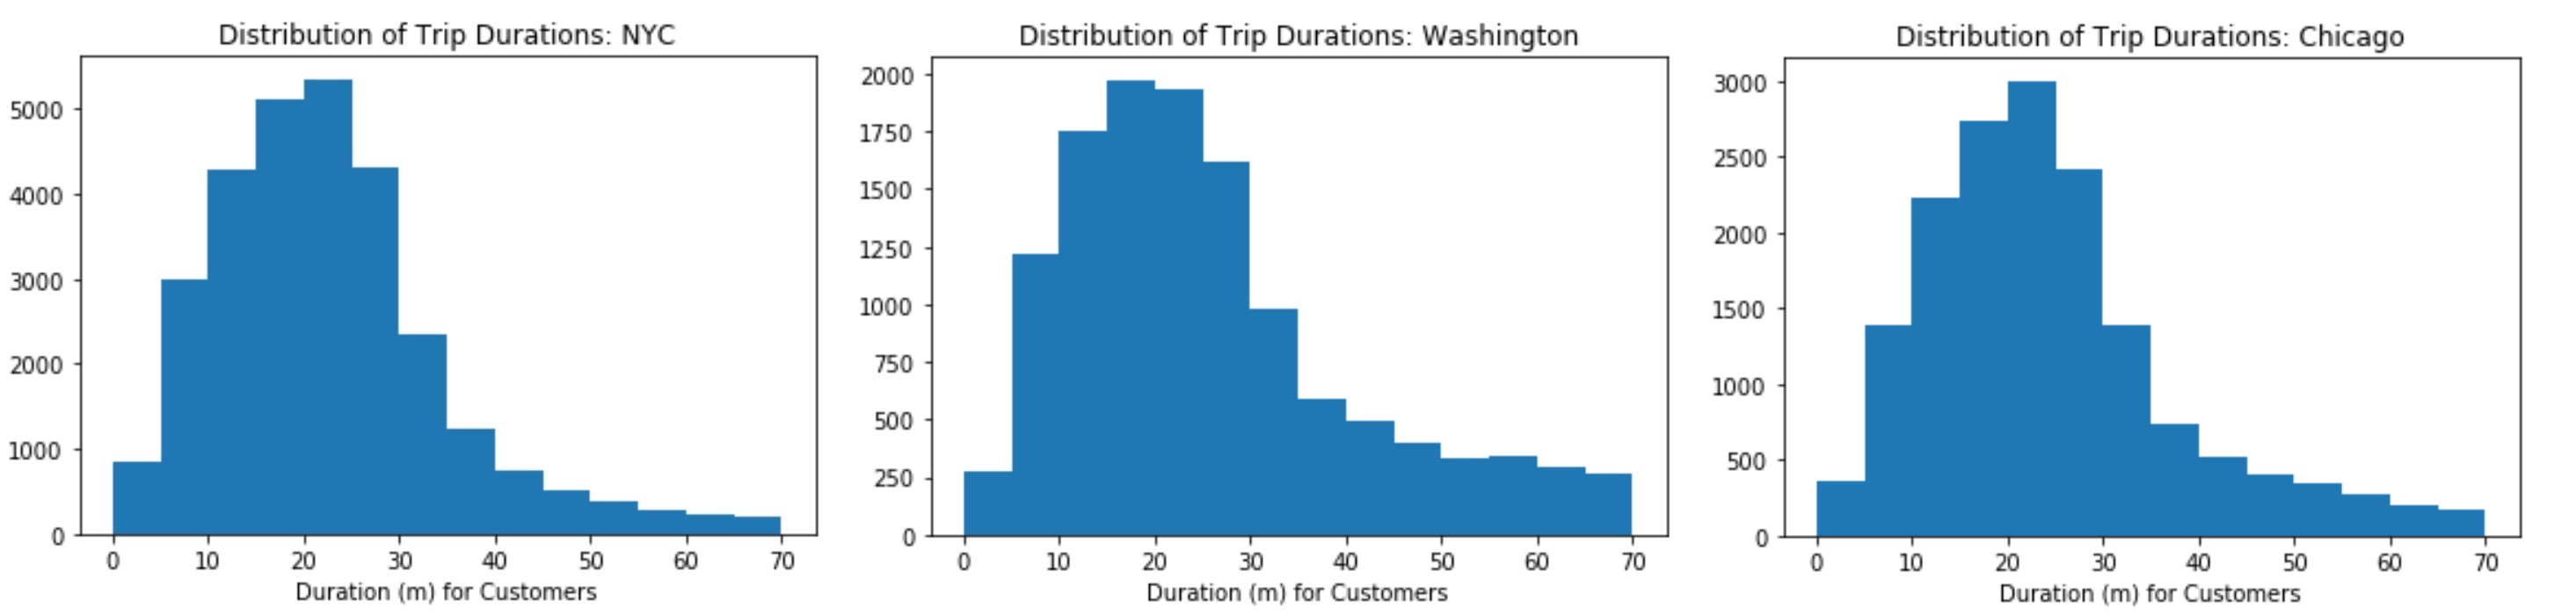
- func_03. triplist_c(filename) :Define a function returning a simple list (not df) then you create a histogram of the trip times for the city (only for Customers)
def triplist(filename):
    with open(filename, 'r') as f_in:
        reader = csv.DictReader(f_in)
        ll = []
        for row in reader:
            ll.append(int(round(float(row['duration'].replace(':','')))))
        return (ll)
for i in data_file:
    plt.hist(triplist(data_file[i]))
    plt.title('Distribution of Trip Durations: {}'.format(i))
    plt.xlabel('Duration (m)')
    plt.show()
-
The first histogram suggests that there are some highly infrequent outliers in the data. Instead of reprocessing the data, we use additional parameters with the
plt.hist(data, bins= a list?)to limit the range of data that is plotted. -
Using
plt.hist(data, bins= a list?), add limits to the plots so that only trips of duration less than 75 minutes are plotted, and set the plots up so that bars are in five-minute wide intervals.
def triplist_s(filename):
    with open(filename, 'r') as f_in:
        reader = csv.DictReader(f_in)
        ll = []
        for row in reader:
            if row['user_type']=='Subscriber':
                ll.append(int(round(float(row['duration'].replace(':','')))))
        return (ll)
for i in data_file:
    plt.hist(triplist_s(data_file[i]), bins= range(0, 75, 5))
    plt.title('Distribution of Trip Durations: {}'.format(i))
    plt.xlabel('Duration (m) for Subscribers')
    plt.show()
def triplist_c(filename):
    with open(filename, 'r') as f_in:
        reader = csv.DictReader(f_in)
        ll = []
        for row in reader:
            if row['user_type']=='Customer':
                ll.append(int(round(float(row['duration'].replace(':','')))))
        return (ll)
for i in data_file:
    plt.hist(triplist_c(data_file[i]), bins = range(0, 75, 5))
    plt.title('Distribution of Trip Durations: {}'.format(i))
    plt.xlabel('Duration (m) for Customers')
    plt.show()
-
##Further exploration: We have compared the relative volume of trips made between three U.S. cities and the ratio of trips made by Subscribers and Customers. For each city, we have investigated differences between Subscribers and Customers in terms of how long a typical trip lasts. We can still continue the exploration in several directions. For example:
- How does ridership differ by month or season? Which month / season has the highest ridership? Does the ratio of Subscriber trips to Customer trips change depending on the month or season?
- Is the pattern of ridership different on the weekends versus weekdays? On what days are Subscribers most likely to use the system? What about Customers? Does the average duration of rides change depending on the day of the week?
- During what time of day is the system used the most? Is there a difference in usage patterns for Subscribers and Customers?
-
[CODE]
Planning: We should recollect the necessary columns and reproduce 3 summary files. First, We want a function that generate new summary files with the three columns of interest for each trip - 1)day of the week, 2)duration, 3)user type - and a single condensing function that produces a final dictionary that consists of 7 classes of 'day_of_week'
##[Data-Condensing]##
- func_01. dur(datum, city) :Takes as input a "dictionary" containing info about a single trip (datum) and its origin city (city) and returns the trip duration in units of minutes.
- func_02. day(datum, city) :Takes as input a dictionary containing info about a single trip (datum) and its origin city (city) and returns the month, hour, and day of the week in which the trip was made.
- func_03. user(datum, city) :Takes as input a "dictionary" containing info about a single trip (datum) and its origin city (city) and returns the type of system user that made the trip.
def dur(datum, city):
    if city=='Washington':
        dura_value = float(datum['Duration (ms)'])/60000
    else:
        dura_value = float(datum['tripduration'])/60
    return(dura_value)

def day(datum, city):
    if city=='Washington':
        month,day,year = (int(x.replace(':','')) for x in datum['Start date'].split()[0].split('/'))
        ans = datetime.date(year, month, day) #creating a datetime-object! [*in: int, *out: int] ==> "datetime.date(2016, 1, 1)"
        day_of_week = ans.strftime('%A') #calculating, using 'year,month,day'
    else:
        month,day,year = (int(x.replace(':','')) for x in datum['starttime'].split()[0].split('/'))
        ans = datetime.date(year, month, day)
        day_of_week = ans.strftime('%A')
    return(day_of_week)

def user(datum, city):
    if city == 'Washington':
        if datum['Member Type']=='Registered':
            user_type = 'Subscriber'
        else:
            user_type = 'Customer'
    else:
        user_type = datum['usertype']
    return(user_type)

def condense_data_2(in_file, out_file, city):
    with open(out_file, 'w') as f_out, open(in_file, 'r') as f_in:
        trip_writer = csv.DictWriter(f_out, fieldnames = ['duration', 'day_of_week', 'user_type'])
        trip_writer.writeheader()
        trip_reader = csv.DictReader(f_in)

        for row in trip_reader:
            new_point = {}
            new_point['duration'] = dur(row, city)
            new_point['day_of_week'] = day(row, city)
            new_point['user_type'] = user(row, city)

            trip_writer.writerow(new_point)

city_info = {'Washington': {'in_file': 'C:/Users/Minkun/Desktop/classes_1/NanoDeg/1.Data_AN/L2/bike-share-analysis/data/Washington-CapitalBikeshare-2016.csv',
                            'out_file': 'C:/Users/Minkun/Desktop/classes_1/NanoDeg/1.Data_AN/L2/bike-share-analysis/data/Washington-2016-Summary.csv'},
             'Chicago': {'in_file': 'C:/Users/Minkun/Desktop/classes_1/NanoDeg/1.Data_AN/L2/bike-share-analysis/data/Chicago-Divvy-2016.csv',
                         'out_file': 'C:/Users/Minkun/Desktop/classes_1/NanoDeg/1.Data_AN/L2/bike-share-analysis/data/Chicago-2016-Summary.csv'},
             'NYC': {'in_file': 'C:/Users/Minkun/Desktop/classes_1/NanoDeg/1.Data_AN/L2/bike-share-analysis/data/NYC-CitiBike-2016.csv',
                     'out_file': 'C:/Users/Minkun/Desktop/classes_1/NanoDeg/1.Data_AN/L2/bike-share-analysis/data/NYC-2016-Summary.csv'}}

for k, v in city_info.items():
    condense_data_2(v['in_file'], v['out_file'], k)
##[Data-Exploring]##
Here, our analysis begins in earnest, buckling down to it! Now the filename is for our 'new summary' files!
- func_01. day_trips_2_s(filename) :Takes as input a dictionary, based on user_type(Subscriber), print the total duration by day_of_week.
- func_02. day_trips_2_c(filename) ::Takes as input a dictionary, based on user_type(Customer), print the total duration by day_of_week.
#For Subscriber
def day_trips_2_s(filename):
    with open(filename, 'r') as f_in:
        reader = csv.DictReader(f_in)
        M = []
        T = []
        W = []
        TH = []
        F = []
        SA = []
        SN = []

        for row in reader:
            if row['user_type']=='Subscriber':
                if row['day_of_week']=='Monday':
                    M.append(int(round(float(row['duration'].replace(':','')))))
                elif row['day_of_week']=='Tuesday':
                    T.append(int(round(float(row['duration'].replace(':','')))))
                elif row['day_of_week']=='Wednesday':
                    W.append(int(round(float(row['duration'].replace(':','')))))
                elif row['day_of_week']=='Thursday':
                    TH.append(int(round(float(row['duration'].replace(':','')))))
                elif row['day_of_week']=='Friday':
                    F.append(int(round(float(row['duration'].replace(':','')))))
                elif row['day_of_week']=='Saturday':
                    SA.append(int(round(float(row['duration'].replace(':','')))))
                elif row['day_of_week']=='Sunday':
                    SN.append(int(round(float(row['duration'].replace(':','')))))
        return (sum(M), sum(T), sum(W), sum(TH), sum(F), sum(SA), sum(SN))


#For Customer
def day_trips_2_c(filename):
    with open(filename, 'r') as f_in:
        reader = csv.DictReader(f_in)
        M = []
        T = []
        W = []
        TH = []
        F = []
        SA = []
        SN = []

        for row in reader:
            if row['user_type']=='Customer':
                if row['day_of_week']=='Monday':
                    M.append(int(round(float(row['duration'].replace(':','')))))
                elif row['day_of_week']=='Tuesday':
                    T.append(int(round(float(row['duration'].replace(':','')))))
                elif row['day_of_week']=='Wednesday':
                    W.append(int(round(float(row['duration'].replace(':','')))))
                elif row['day_of_week']=='Thursday':
                    TH.append(int(round(float(row['duration'].replace(':','')))))
                elif row['day_of_week']=='Friday':
                    F.append(int(round(float(row['duration'].replace(':','')))))
                elif row['day_of_week']=='Saturday':
                    SA.append(int(round(float(row['duration'].replace(':','')))))
                elif row['day_of_week']=='Sunday':
                    SN.append(int(round(float(row['duration'].replace(':','')))))
        return (sum(M), sum(T), sum(W), sum(TH), sum(F), sum(SA), sum(SN))
##[Plotting]##
data_file= {'Washington': 'C:/Users/Minkun/Desktop/classes_1/NanoDeg/1.Data_AN/L2/bike-share-analysis/data/Washington-2016-Summary.csv',
            'Chicago': 'C:/Users/Minkun/Desktop/classes_1/NanoDeg/1.Data_AN/L2/bike-share-analysis/data/Chicago-2016-Summary.csv',
            'NYC': 'C:/Users/Minkun/Desktop/classes_1/NanoDeg/1.Data_AN/L2/bike-share-analysis/data/NYC-2016-Summary.csv'}

for i in data_file:
    data = day_trips_2_s(data_file[i])
    labels = ['M', 'T', 'W', 'TH', 'F', 'SA', 'SN']
    plt.bar(range(len(data)), data, align='center') # x is a range..y is the data...
    plt.ylim(ymax = 600000)
    plt.xticks(range(len(data)), labels, rotation='vertical')
    plt.title('Trip Durations for Subscribers: {}'.format(i))
    plt.show()

    data2 = day_trips_2_c(data_file[i])
    labels = ['M', 'T', 'W', 'TH', 'F', 'SA', 'SN']
    plt.bar(range(len(data)), data2, align='center') # x is a range..y is the data...
    plt.ylim(ymax = 600000)
    plt.xticks(range(len(data)), labels, rotation='vertical')
    plt.title('Trip Durations for Customers: {}'.format(i))
    plt.show()
