![]()
An Intelligent Color Management System for Python Visualization
Automatic • Consistent • Accessible • Smart
![]()


In scientific research, high-quality visualizations are crucial for clearly communicating findings. However, poor color management can often undermine the story the data is telling. Python users creating publication-quality figures commonly face several challenges:
- ❌ Inconsistent Colors: Maintaining a unified visual style is difficult when switching between libraries like
matplotlib,seaborn, andplotly. - ❌ Manual Tweaking: Each plot requires tedious manual color specification, a process that is both time-consuming and hard to reproduce.
- ❌ Lack of Intelligent Tools: There is a shortage of tools that automatically select appropriate colormaps (e.g., distinguishing between sequential and diverging data) or simulate for color vision deficiencies.
- ❌ Accessibility Issues: Approximately 8% of men have some form of color vision deficiency. Improper color choices can render plots uninterpretable to a significant portion of the audience.
Huez addresses these problems through a simple API that automates the best practices of color management.
pip install huezWith a single line of code, you can establish a unified, intelligent, and adaptive color system for your entire visualization workflow.
import huez as hz
import matplotlib.pyplot as plt
import seaborn as sns
import numpy as np

# 🎨 Apply a theme with one line, automatically configuring multiple libraries
hz.use("scheme-1")

# --- Matplotlib & Seaborn automatically use consistent colors ---

# 1. Automatic color handling for scatter and line plots
# Huez intelligently expands the color palette when categories exceed the default
categories = [f'Type {i+1}' for i in range(15)]
for cat in categories:
    plt.plot(np.random.rand(10), label=cat)
plt.title("Huez Automatically Expands Discrete Colors")
plt.show()

# 2. Smart detection and application of the best colormap
# Data ranges from -1 to 1 (diverging)
correlation_data = np.random.rand(10, 10) * 2 - 1
sns.heatmap(correlation_data) # Huez auto-detects diverging data and applies "coolwarm"
plt.title("Huez Intelligently Detects a Diverging Colormap")
plt.show()
The core strengths of Huez are automation and intelligence, allowing it to handle the heavy lifting behind the scenes:
- Intelligent Color Expansion: When the number of categories exceeds the palette's default color count, Huez interpolates in the perceptually uniform LAB color space to generate a new set of visually distinct colors.
- Smart Colormap Detection: Automatically analyzes the data passed to
seaborn.heatmaporplt.imshowto select the most appropriate colormap type (sequential, diverging, or cyclic). - Cross-Library Consistency: Ensures that
matplotlib,seaborn,plotly,altair, andplotnineall share the same color and style configuration. - Multi-Mode Output: Provides color schemes optimized for screen, print (grayscale-friendly), and presentation (high-contrast).
- Built-in Accessibility: All default schemes are designed to be friendly to viewers with common color vision deficiencies, ensuring your research is accessible to a wider audience.
- Academic Journal Styles: Includes built-in color and style themes from top-tier journals (e.g., Nature, Lancet, Science), simplifying the publication process.
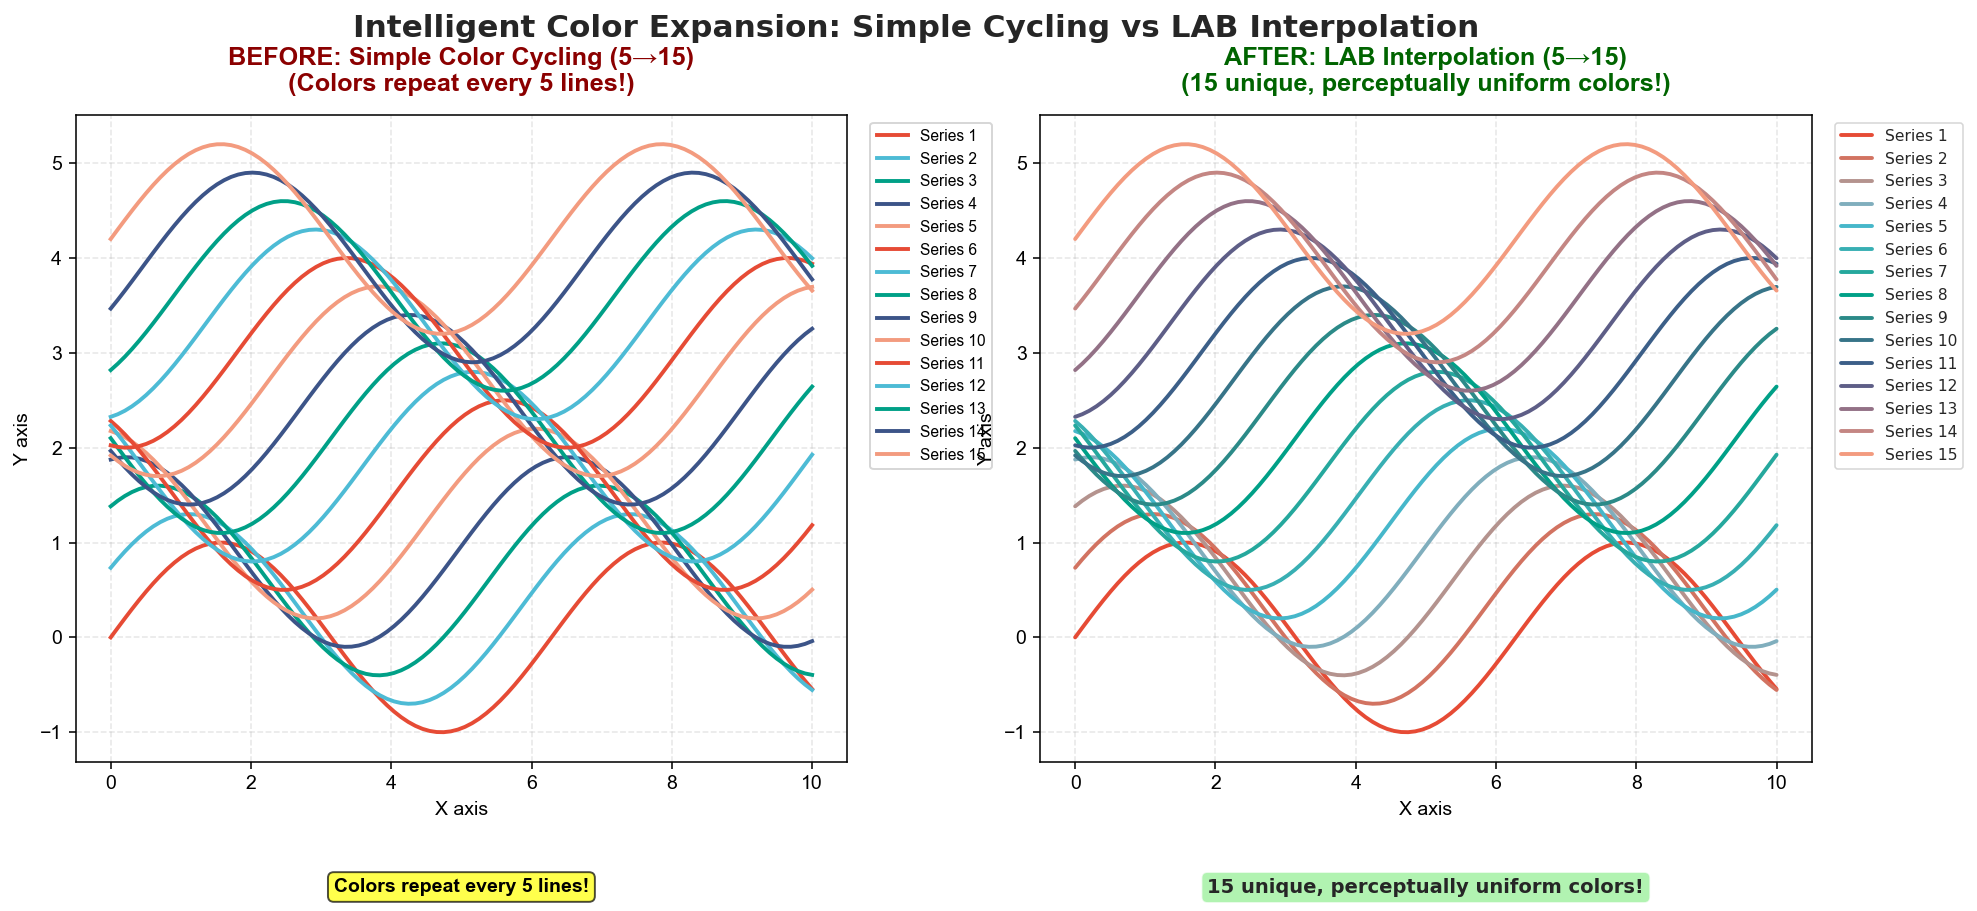
Problem: Default palettes typically offer 5-10 colors. When plotting more categories, colors are recycled, causing confusion. Huez Solution: Uses perceptually uniform interpolation in LAB space to generate a larger set of unique, easily distinguishable colors.
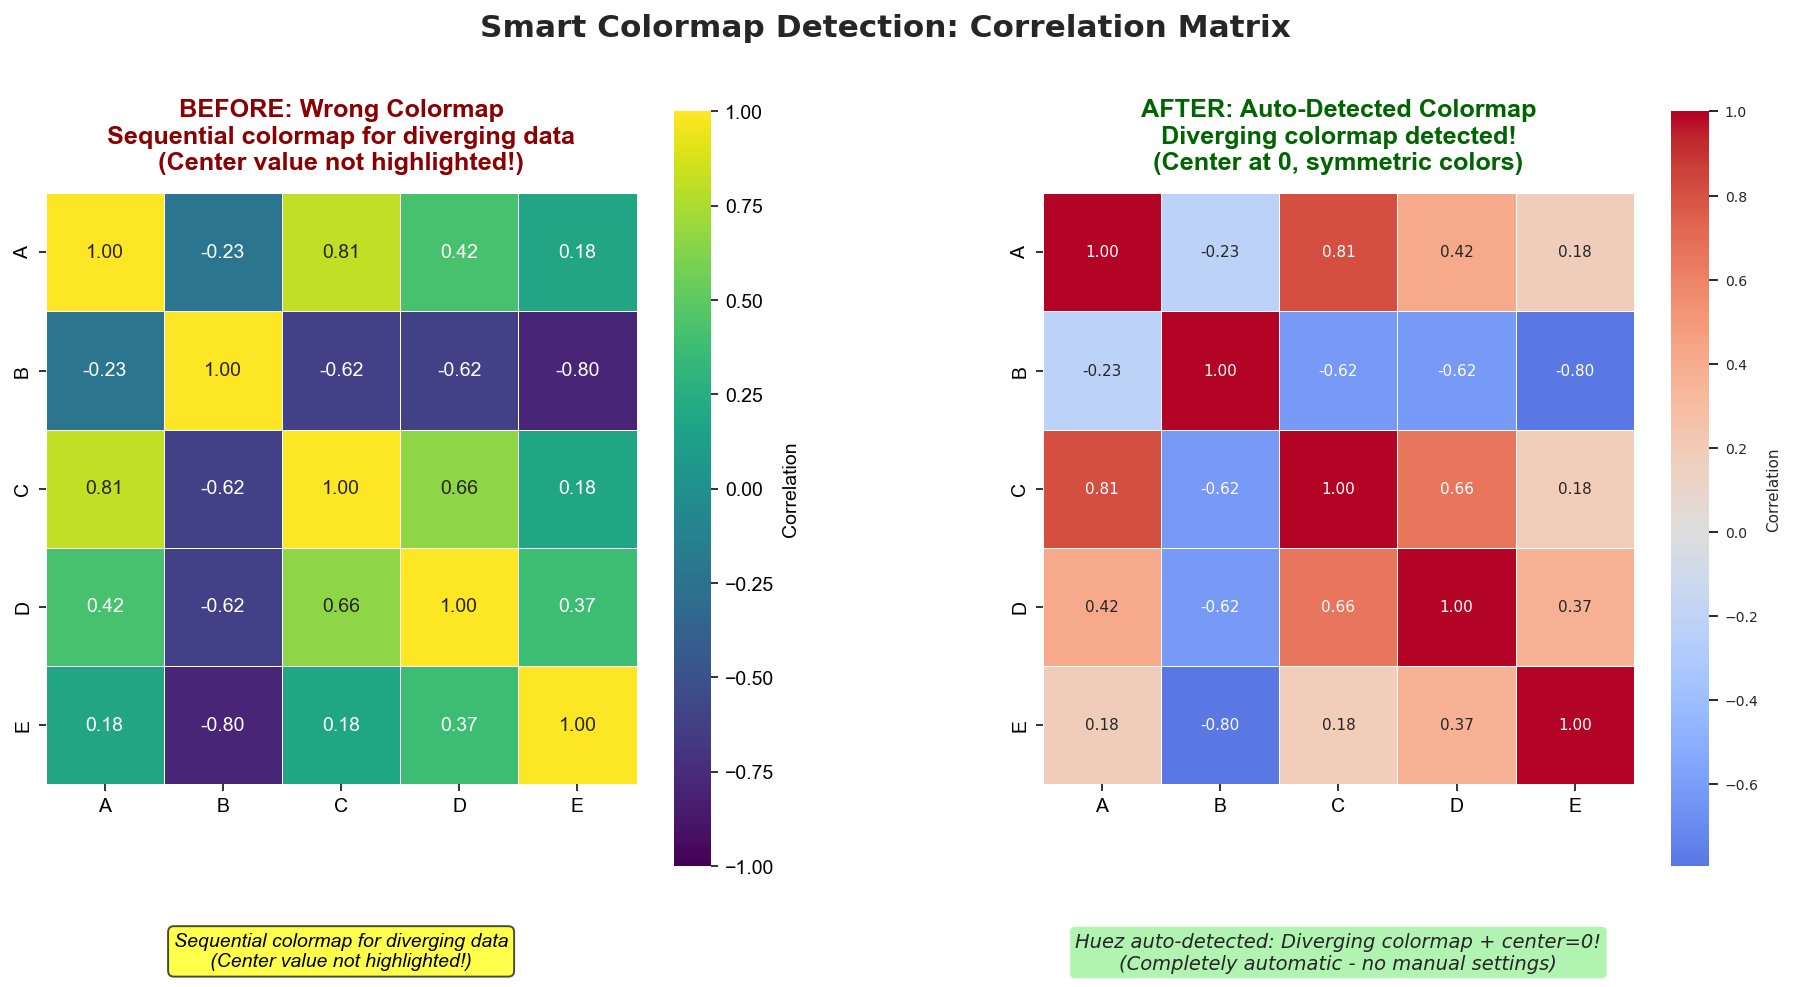
Problem (Left): A sequential colormap (viridis) is used for a correlation matrix, which contains both positive and negative values. The visual center of the colormap does not align with the meaningful data center (0). Huez Solution (Right): Automatically detects that the data is diverging and applies a diverging colormap (coolwarm), which is centered at 0 and uses symmetric colors.
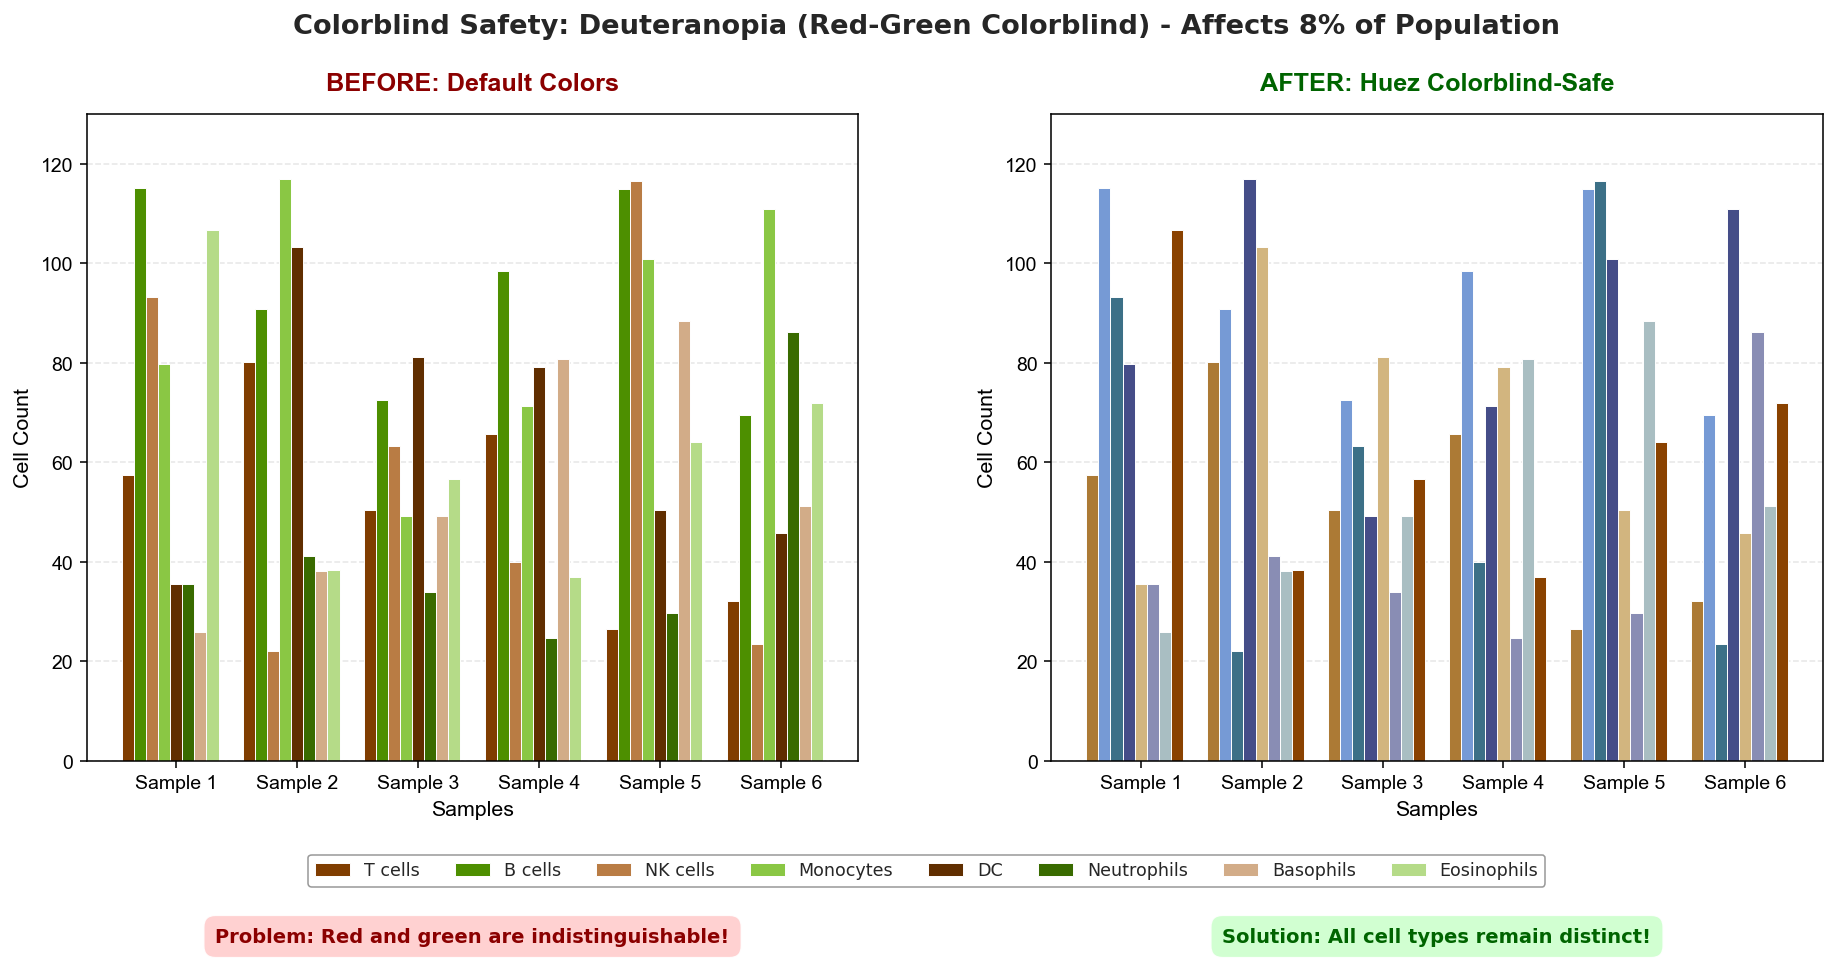
Simulated under Deuteranopia (red-green color blindness):
- Before (Left): The default red and green colors become nearly indistinguishable.
- After (Right): Huez's colorblind-safe palette ensures all 8 categories remain distinct and clearly interpretable.
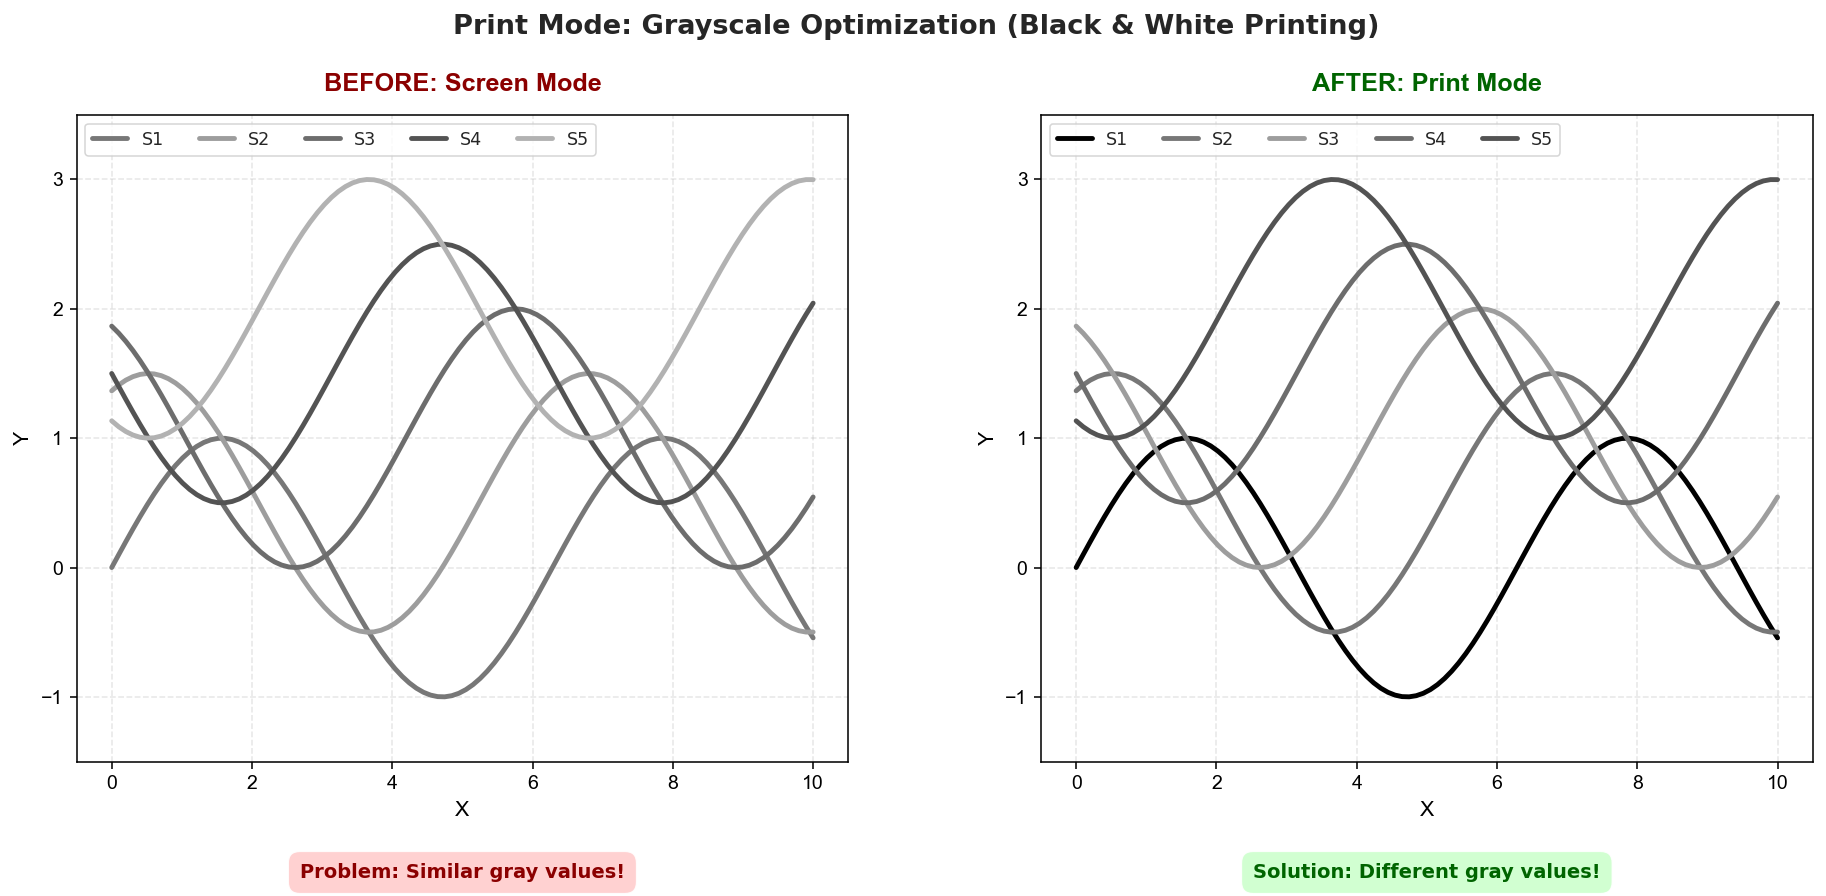
When the plot is printed in black and white:
- Before (Left): Colors designed for screens may convert to very similar grayscale luminance values, making lines merge together.
- After (Right):
mode="print"selects colors that are well-separated in their grayscale equivalents, ensuring clarity in print.
Before applying a scheme, you can preview its colors and check its properties.
import huez as hz

# Interactively preview a color scheme
hz.preview("scheme-1")

# Preview the scheme's appearance in print mode
hz.preview("scheme-1", mode="print")

# List all available built-in schemes
schemes = hz.list_schemes()
print(schemes)
# Output: ['scheme-1', 'scheme-2', 'lancet', 'nejm', ...]

# Enforce color vision deficiency safety
# This will raise an error if the selected scheme is not accessible
hz.use("scheme-1", ensure_accessible=True)
📚 Supported Libraries
Huez seamlessly integrates with the following major Python visualization libraries:
- Matplotlib:
plt.plot(),plt.scatter(), etc. - Seaborn:
sns.scatterplot(),sns.heatmap(), etc. - plotnine:
(ggplot(...) + geom_point()), etc. - Altair:
alt.Chart(...).encode(color=...), etc. - Plotly:
go.Figure()andplotly.express, etc.
🎨 Custom Schemes
You can create or override schemes using a simple YAML configuration file.
1. Create my_config.yaml:
version: 1
default_scheme: my_custom_scheme
schemes:
  my_custom_scheme:
    title: "My Custom Style"
    fonts: { family: "Arial", size: 10 }
    palettes:
      discrete: "okabe-ito"  # Use a built-in colorblind-safe palette
      sequential: "viridis"
      diverging: "coolwarm"
    style: { grid: "y", legend_loc: "best" }
2. Load and use:
import huez as hz

hz.load_config("my_config.yaml")
hz.use("my_custom_scheme")
🆚 Comparison with Other Tools
| Feature | Huez | palettable | seaborn | plotly | colorcet |
|---|---|---|---|---|---|
| Cross-Library Unification | ✅ 5 Libraries | ❌ | ❌ | ❌ | ❌ |
| Intelligent Color Expansion | ✅ LAB Space | ❌ | ❌ | ❌ | ❌ |
| Smart Colormap Detection | ✅ Automatic | ❌ | ❌ | ❌ | ❌ |
| CVD Safety Checks | ✅ Built-in | ❌ | ❌ | ❌ | ❌ |
| One-Line Global Setup | ✅ hz.use() |
❌ | 🟡 | 🟡 | ❌ |
| Academic Journal Styles | ✅ 6+ | 🟡 | ❌ | ❌ | ❌ |
Huez's unique contribution is its built-in intelligence layer that automates adaptation to data and context.
Contributions are welcome! If you have ideas, suggestions, or bug reports, please feel free to open an Issue or submit a Pull Request.
This project is committed to fostering an open and welcoming environment.
This project is licensed under the MIT License. See the LICENSE file for details.
Making Scientific Visualization Simpler and More Robust.
⭐ Star us on GitHub if Huez saves you time!