A Grammar of Graphics for Kotlin.


Lets-Plot Kotlin API is a Kotlin API for Lets-Plot Multiplatform
plotting library,
which is built on the principles of layered graphics first described in the
Leland Wilkinson work The Grammar of Graphics.
|
Lets-Plot Kotlin API is largely based on the API To learn more about the Grammar of Graphics, This will be a good prerequisite for further exploration of the Lets-Plot library. |
Inside Kotlin Notebook, Datalore or Jupyter with Kotlin Kernel:
%use lets-plot
val rand = java.util.Random()
val data = mapOf(
    "rating" to List(200) { rand.nextGaussian() } + List(200) { rand.nextGaussian() * 1.5 + 1.5 },
    "cond" to List(200) { "A" } + List(200) { "B" }
)

var p = letsPlot(data)
p += geomDensity(color = "dark_green", alpha = .3) { x = "rating"; fill = "cond" }
p + ggsize(700, 350)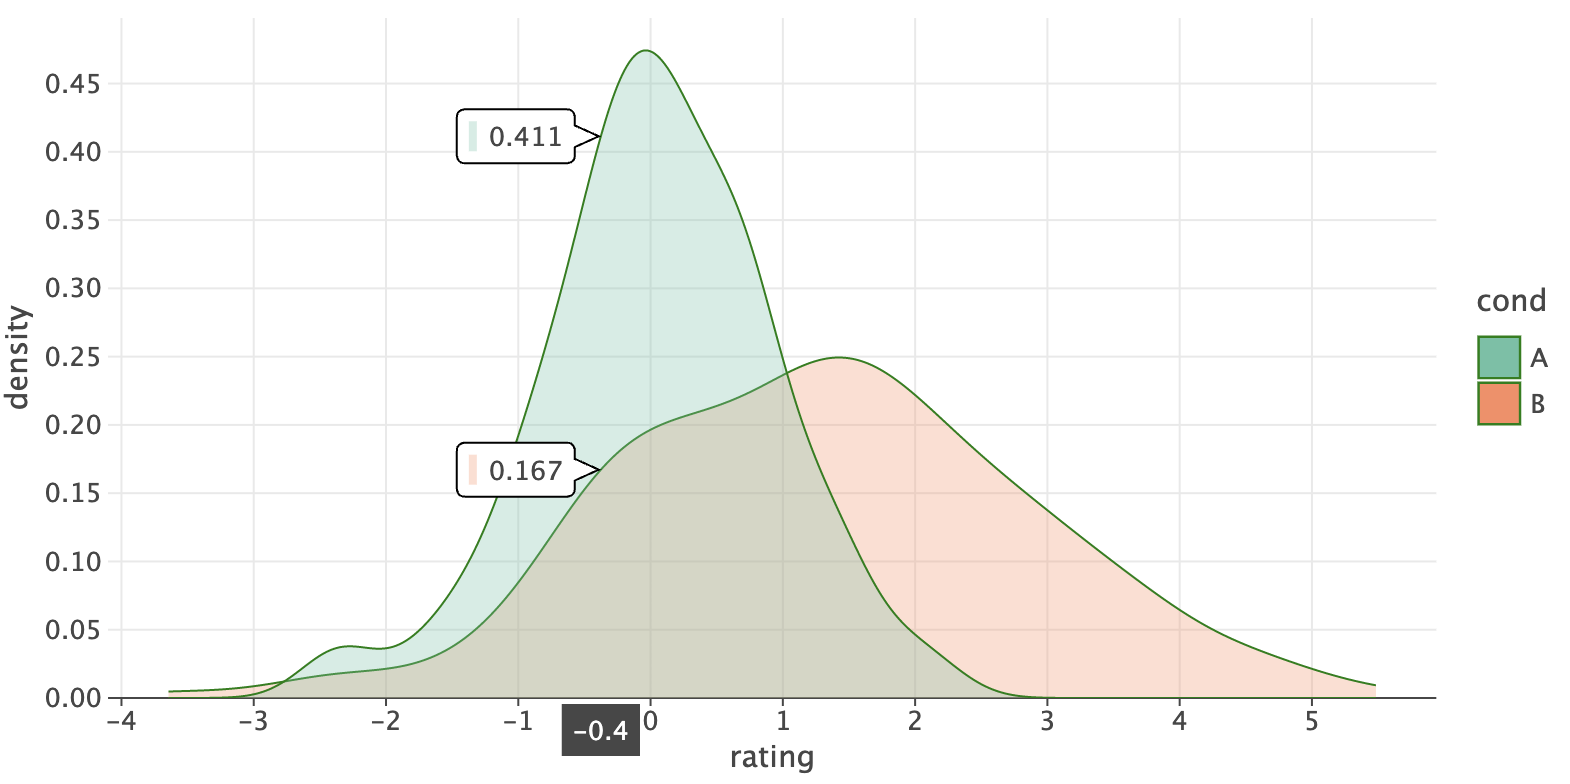
See the "Quickstart" notebook in Datalore or Jupyter nbviewer.
- Usage
- Documentation
- What is new in 4.11.0
- Recent Updates in the Gallery
- Change Log
- Code of Conduct
- License
With the help of Lets-Plot Kotlin API you can easily create plots in Kotlin Notebook,
Datalore, Jupyter with Kotlin Kernel
or any other notebook that supports Kotlin Kernel.
%use lets-plot
This "line magic" will apply Lets-Plot library descriptor which adds to your notebook all the boilerplate code necessary to create plots.
By default, library descriptor is bundled with the Kotlin Jupyter Kernel installed in your environment.
However, you can override the default settings using:
%useLatestDescriptors
In this case the latest library descriptor will be pulled from the Kotlin Jupyter Libraries repository.
%use lets-plot(v=4.11.0, isolatedFrame=false)
v- version of the Lets-Plot Kotlin API.isolatedFrame- Iffalse: load JS just once per notebook (default in Jupyter). Iftrue: include Lets-Plot JS in each output (default in Datalore notebooks).
To learn how to embed Lets-Plot charts in Compose Multiplatform applications, please check out the Lets-Plot Skia Frontend project.
To learn more about creating plots in JVM or Kotlin/JS environment please read USAGE_SWING_JFX_JS.md.
Examples of using of the Lets-Plot Kotlin API in JVM and Kotlin/JS applications are available in the Lets-Plot Kotlin Mini Apps (Demos) GitHub repository.
-
Lets-Plot Kotlin API documentation and API reference: Lets-Plot for Kotlin
-
A quick introduction to the Grammar of Graphics and Lets-Plot Kotlin API: Lets-Plot Usage Guide
-
- Support temporal data types from
kotlinx.datetime,java.time, andjava.util. - Support for timezone-aware
java.time.ZonedDateTimeandjava.time.OffsetDateTimeobjects.
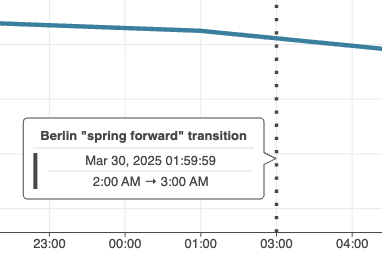
See Date-time cookbook.
See Bitcoin trading demo.
- Support temporal data types from
-
See: example notebook.
-
See: example notebook.
-
-
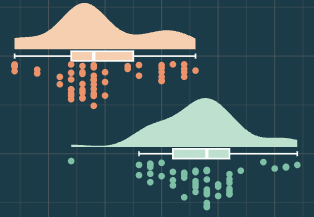
Annotations support via
relativeLabelsandabsoluteLabelsparameters.
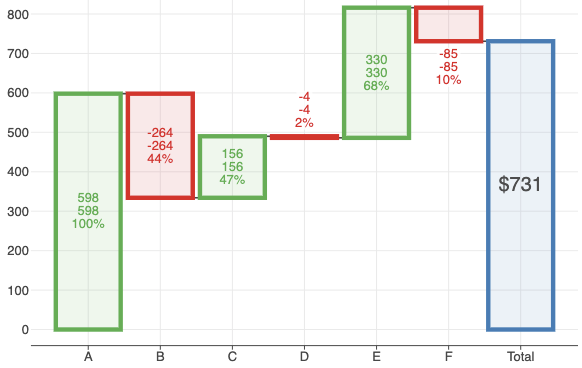
See: example notebook.
-
Support for combining waterfall bars with other geometry layers.
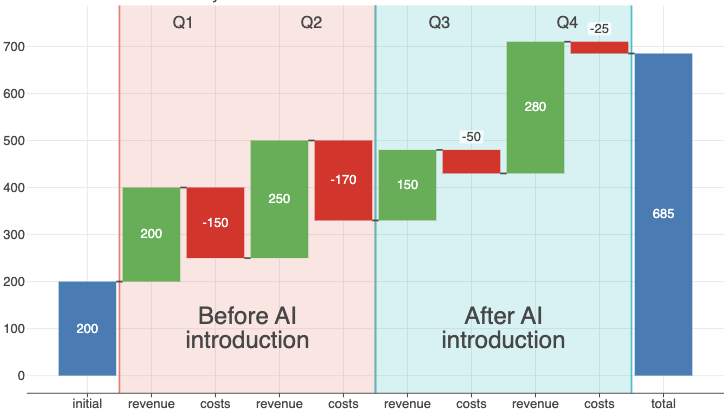
See: example notebook.
-
-
Continuous data when used with discrete positional scales is no longer transformed to discrete data.
Instead, it remains continuous, allowing for precise positioning of continuous elements relative to discrete ones.
See: example notebook.

Tip
New way of handling continuous data on discrete scales could potentially break existing plots.
If you want to restore a broken plot to its original form, you can use the asDiscrete() function to annotate continuous data as discrete.
-
The default plot layout has been improved to better accommodate axis labels and titles.
Also, newtheme()optionsaxisTextSpacing,axisTextSpacingX, andaxisTextSpacingYcontrol spacing between axis ticks and labels.
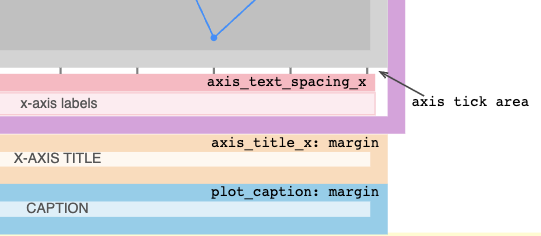
See new Plot Layout Diagrams showing various layout options and their effects on plot appearance.
-
See CHANGELOG.md for a full list of changes.
Recent Updates in the Gallery
See CHANGELOG.md.
This project and the corresponding community are governed by the JetBrains Open Source and Community Code of Conduct. Please make sure you read it.
Code and documentation released under the MIT license. Copyright © 2019-2025, JetBrains s.r.o.