This is a guide showing how you can expose metrics from certain devices on your tailnet, and then get them visualized in Grafana with the help of Prometheus.
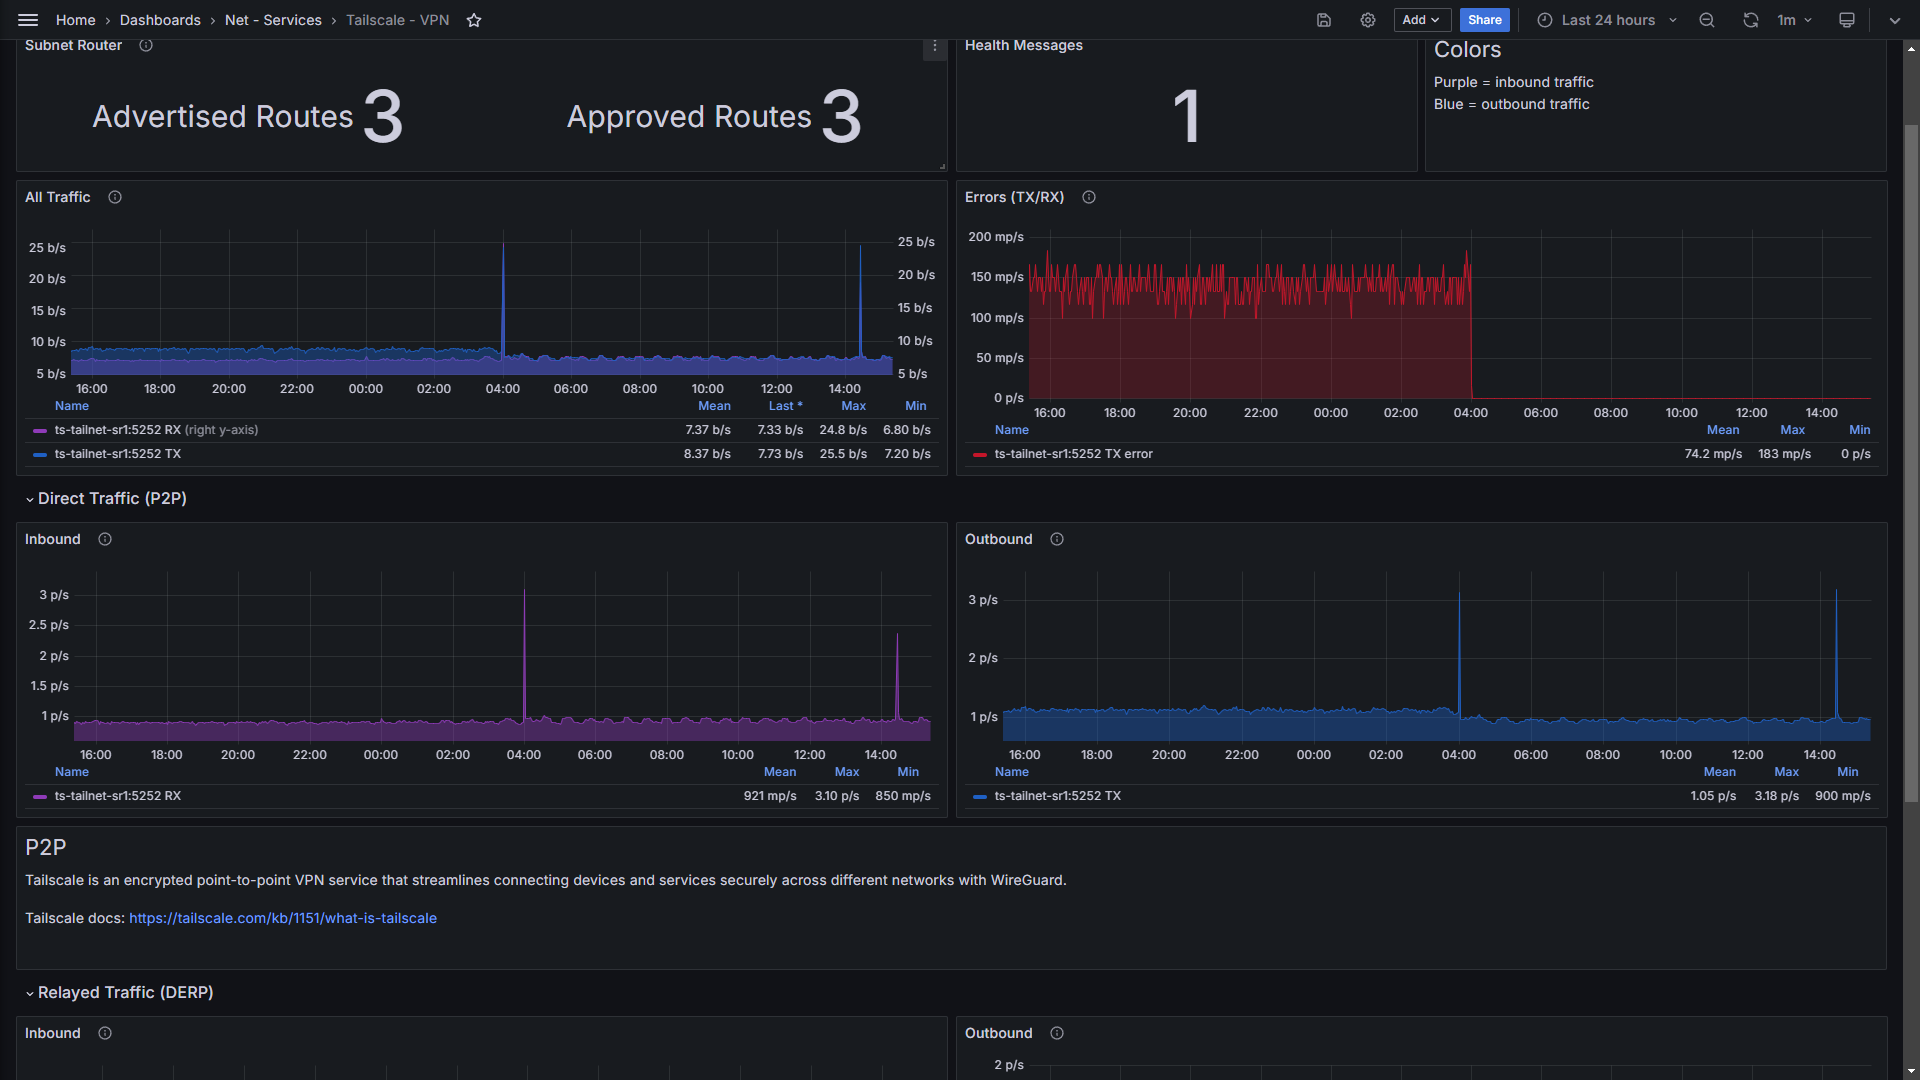
This is a relatively new function added by Tailscale, see: https://tailscale.com/kb/1482/client-metrics. With this, you can visualize all traffic that goes through tailscale, aswell as how many routes are advertised and approved.
Note
OBS! This guide assumes you know how Tailscale, Prometheus, and Grafana works. If something is unclear, please read their documentation respectively (everything should be available there).
It also assumes that if you self host Prometheus and Grafana, the device that hosts those systems can talk to your tailnet either via a subnet router or by being directly connected with Tailscale.
- With your terminal of choice, SSH into your device you want to see data from. Run
tailscale web --listen. This will export any metrics tohttp://tailscale-ip:5252/metricsas displayed by the command in the CLI. - Go to the link to see if you can see the metrics listed, then the data should be available for Prometheus to scrape it.
- Edit your prometheus.yml file. Create a new job with the target that is your tailscale IP and port where the metrics can be found.
job_namecan be whatever you want, if you have lots of different jobs i suggest using a logical naming scheme.
  - job_name: 'tailscale-metrics'
    static_configs:
      - targets:
           - '100.123.123.123:5252'
           - '100.123.123.124:5252'
Note
If you self host Pi-hole or any other DNS, i suggest you create an A record for the Tailscale IPs of your devices. If prometheus uses the Pi-hole as DNS, you can instead input the DNS hostnames of the devices under targets:. This makes it easier to differentiate between your devices when selecting which one you want to see stats from in Grafana, otherwise you will have to remember the IP addresses.
- Go to your Prometheus instance via your browser and see if the job is up or down. If UP, then you've successfully scraped the metrics. If it's down, then you need to check every step and make sure that the Prometheus instance is able to talk to your tailnet devices.
Create a new dashboard and choose "import". Input the JSON code from this repo and load it. You might have to have Prometheus connected as a datasource before doing this step, otherwise you may see errors / no data. Then you should be done! I'm not entirely sure why, but the data might not be visible if you choose a time period lower than 12h or 24h.