![]()


Scalabel (pronounced "sca⋅label") is a versatile and scalable annotation platform, supporting both 2D and 3D data labeling. BDD100K is labeled with this tool.
Documentation | Overview Video | Discussion | Contributors
- Main features
- Quick Start
- Creating a new annotation project
- Image tagging
- 2D bounding box detection and tracking annotation
- 2D polygon/polyline and tracking annotation
- 3D bounding box detection and tracking annotation on point clouds
- Real-time session synchronization for seamless collaboration
- Semi-automatic annotation with label pre-loading
- Python API for label handling and visualization
- Contributors
Try Scalabel on your local machine
git clone https://github.com/scalabel/scalabel
cd scalabel

chmod +x scripts/setup_ubuntu.sh scripts/setup_osx.sh scripts/setup_local_dir.sh
# Or run scripts/setup_osx.sh for MacOS
. scripts/setup_ubuntu.sh
. scripts/setup_local_dir.sh
npm run serve
Open your browser and go to http://localhost:8686 to use Scalabel. You can check our project configuration examples to create some sample projects.
The Python API can be installed through pip:
python3 -m pip install -U scalabel- Supporting importing popular data formats such as 2D images and 3D point clouds
- Convenient data uploading using integrated or multiple configuration files for items, categories, and attributes
- Divide a project into multiple tasks using variable task sizes
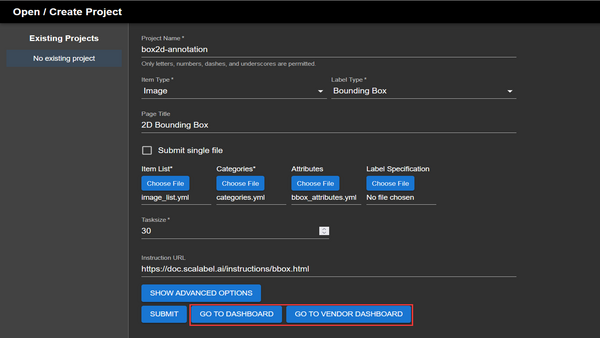
Creating a project consists of filling in the fields that specify the task, data type, and other parameters such as the task size. Item lists, categories, and attributes must be in the Scalabel format when uploaded.
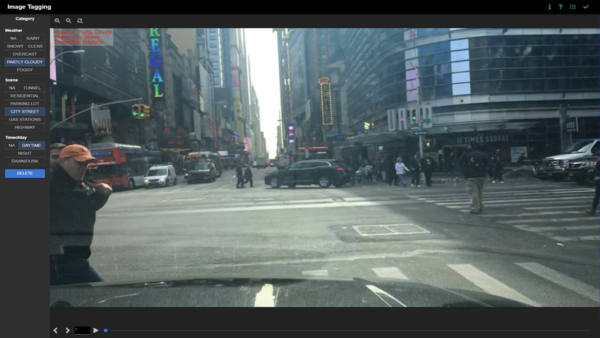
Images can be tagged with multiple attributes. Categories include weather, scene, and time of day as defaults, but can be freely customised.
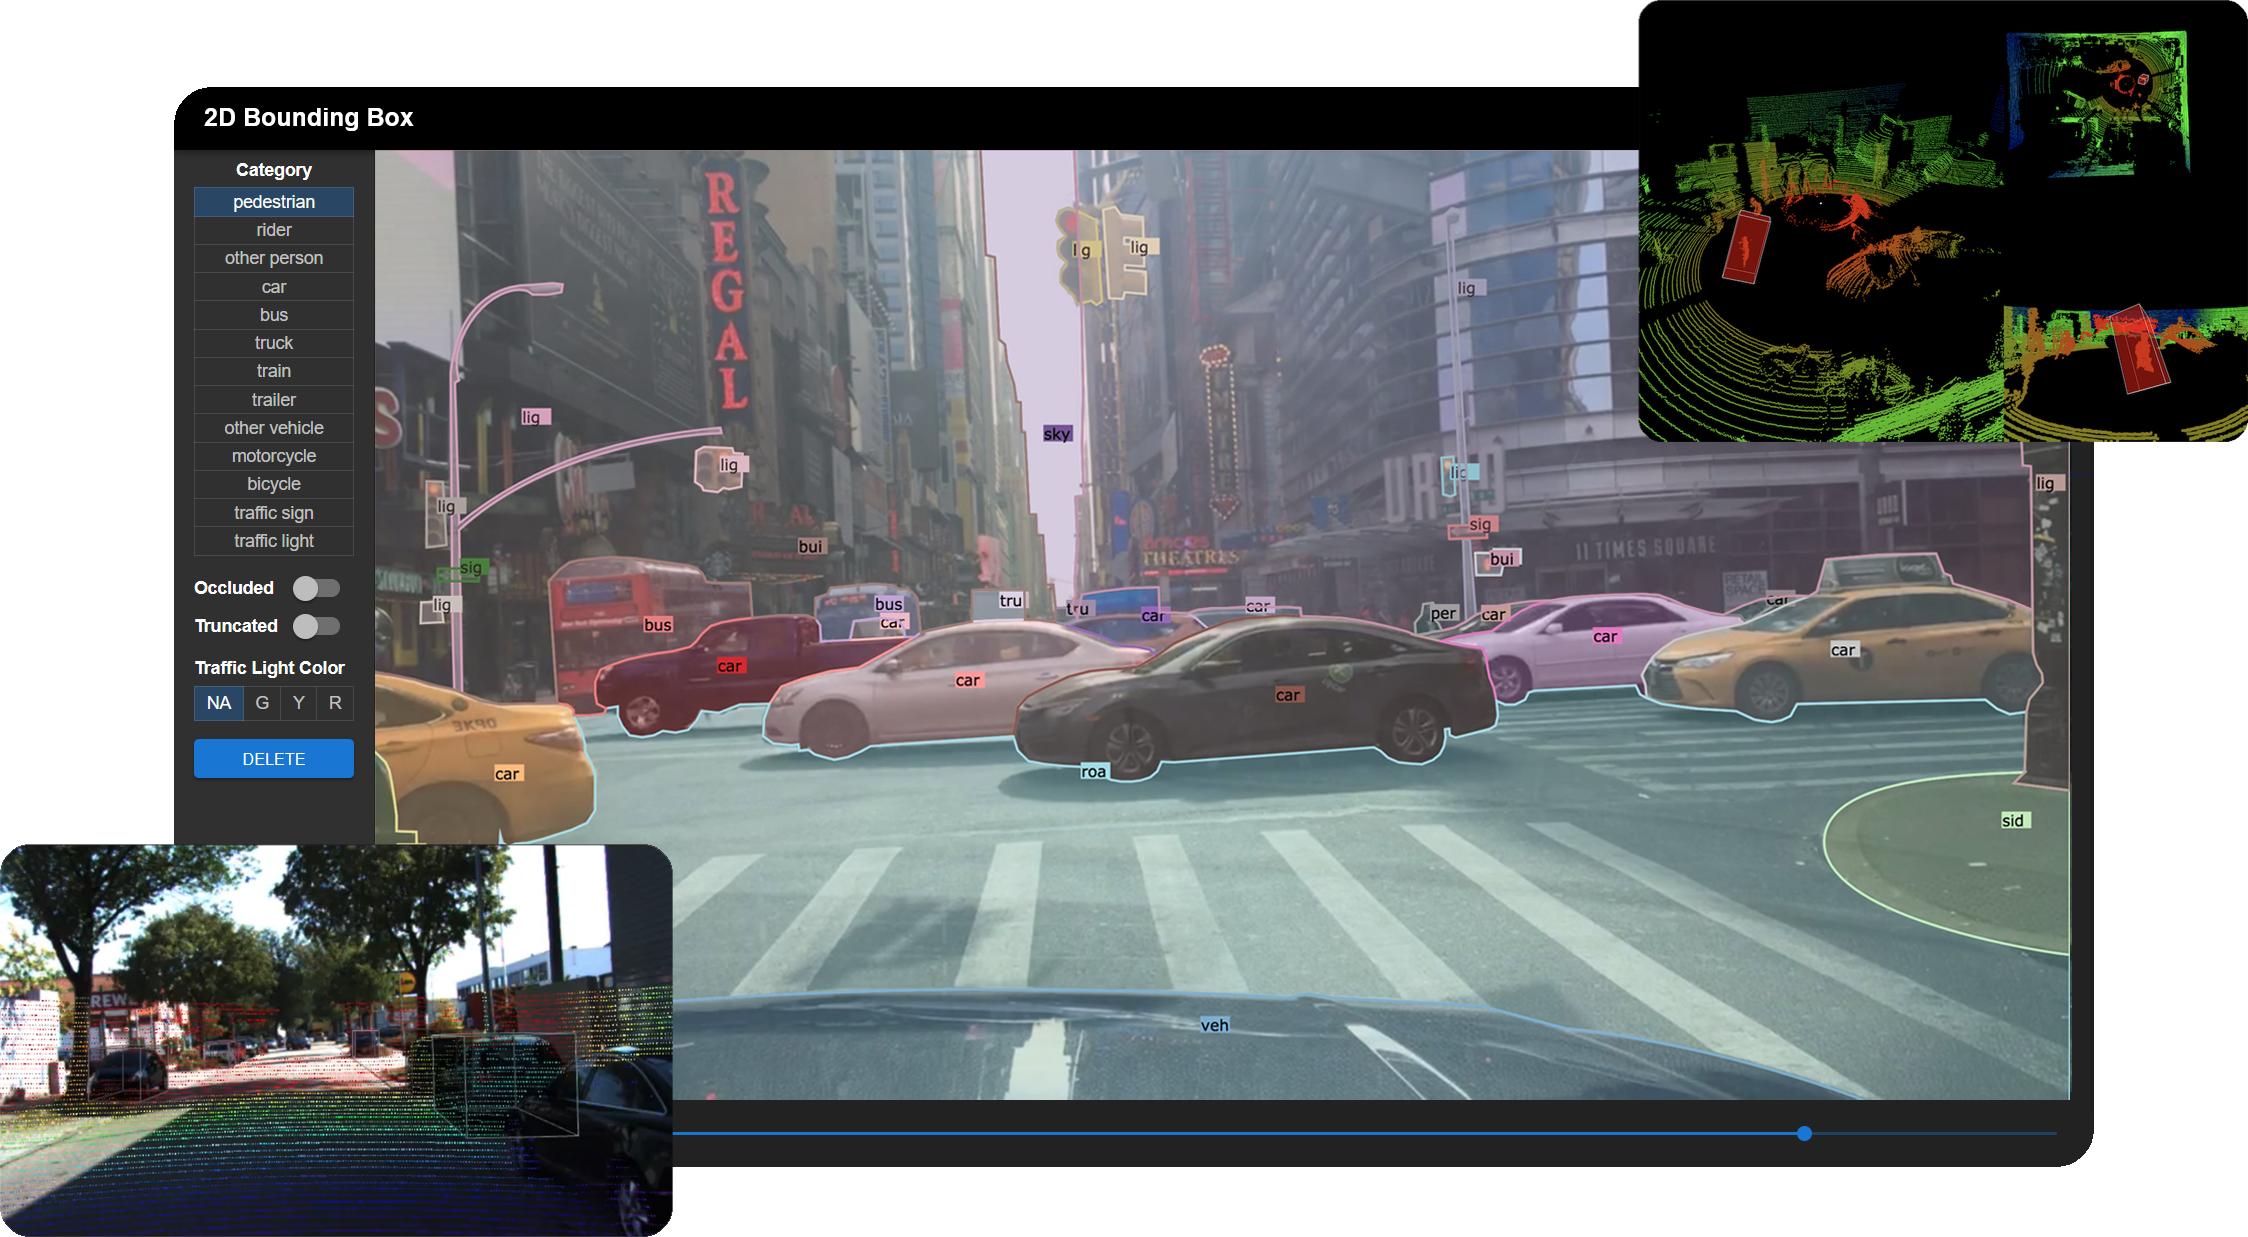
- Simple click-and-drag area selection
- Group boxes into a wide range of categories
- Provides extra configurable options such as occlusion, truncation, and traffic light colours
- Tracking between keyframes
Create bounding boxes by selecting an area on the canvas. Bounding boxes can be freely adjusted and moved around. Categories and attributes of the bounding boxes can be customised. Bounding boxes can be linked between frames if the object disappears and reappears in subsequent frames. Linked bounding boxes are colour-coded to indicate the link.
![]()
Bounding boxes are interpolated between keyframes if the position, orientation, or scale of the bounding boxes differ. This is useful for tracking objects that move between keyframes.
- Choosing between closed paths for image segmentation or open paths for lane marking
- Supporting bezier curves for precise annotation for round objects
- Tracking interpolation between keyframes
Click on multiple points on the canvas to generate vertices of a polygon. Click on the first vertex to close the polygon. Vertices can be moved around, and new vertices can be added by clicking on the midpoint of the line segment between two vertices. Creating bezier curves is also supported for smoother labeling of curved objects.
Polylines can be created for lane marking. They support the same functions as polygons, but do not have to be closed.
![]()
Polygons are interpolated between keyframes if the position, orientation, or scale of the polygons differ. This is useful for tracking objects that move between keyframes.
- Multi-sensor view for side-by-side comparison with corresponding 2D images
- Simple four-point click to generate 3D bounding boxes
- Supporting undo and panning functions during annotation for added precision
- Tracking interpolation between keyframes
Click on the canvas to define the length, breadth, and height of the 3D bounding box. There is an in-built ground plane prediction that aligns the 3D bounding box with the ground. Bounding boxes can be freely adjusted and moved around. Categories and attributes of the bounding boxes can be customised. Bounding boxes can be linked between frames if the object disappears and reappears in subsequent frames. Linked bounding boxes are colour-coded to indicate the link.
![]()
Bounding boxes are interpolated between keyframes if the position, orientation, or scale of the bounding boxes differ. This is useful for tracking objects that move between keyframes.
Multiple sessions can be initialised by opening new windows or tabs. Each session synchronises its changes in labels and tags with the other sessions in real-time. Tracking changes are also updated in real-time as well.
Deep learning models can be used to assist annotation for large batches of data. New models can be trained on a subset of the data, and the remaining data can be uploaded for Scalabel to label automatically. The labels can be preloaded in the backend and can also be manually adjusted in the interface.
- Providing convenience scripts for converting from and to other popular formats, such as COCO, KITTI, Waymo
- Supporting evaluation of various tasks with the Scalabel format
- Image tagging
- Detection
- Pose estimation
- Instance segmentation
- Semantic segmentation
- Panoptic segmentation
- Boundary detection
- Bounding box tracking
- Segmentation tracking
- Contains a visualizer to easily visualize annotations as well as model predictions in Scalabel format
Python backend provides a convenient API for label handling and visualization. For compatibility with Scalabel's interface, datasets can be converted to the appropriate formats via scripts. Algorithms can be evaluated for each task by uploading the predictions and corresponding ground truth annotations in the Scalabel format. The labels can be easily visualised using the Python interface.
This modified version of Scalable provides a 4-Step process to Annotated selected images with the help of alternative sensor input. In order to label RGB images with support from various different sensors, that all output different types of data and formats, a 4-step process was developed. First, the raw sensor data gets pre-processed into overlays that a labeler can use for additional context. Then candidate frames can be selected and tagged with attributes followed by one more intermediary processing script before the images can be finally labeled.
To pre process the data the provided preprocessing script expects the data to be in the following format:
- data_folder
- rgb
- img_000000.png
- img_000001.png
- ...
- radar
- bev
- bev_000000.png
- bev_000001.png
- ...
- bev
- lidar
- pointcloud_000000.ply
- pointcloud_000001.ply
- ....
- events.h5
- rgb_timestamps.txt
- radar_timestamps.txt
- lidar_timestamps.txt
- rgb
To execute it simply call the script
python scalabel/tools/Step_1_Preprocessing.py {path to the data_folder}It will create overlays (this may take some time) for the sensors present and also generate a Main_config.json and a Sensors_config.json file which can be used for the next step.
The radar BEV's are expected to be centered, meaning the center pixel is where the sensor is expected to be. Further each pixel is expected to be equal to 0.0432m/pixel to change this value or where the the sensor is located in the BEV, adjust the code in file app/src/components/radar_canvas.tsx:312
-
In the script you can change the value for the event time delta. Meaning, the amount of events aggregated for each overlay. Change the value
event_time_delta_usat the top of the file to do so. -
Also at the top of this script you can set the size of the event frame. Default 1280x720
-
Adjust the
project_pointcloud.pyfile for the calibration between Camera and Lidar, the resolution of the output overlay and to adjust the color mapping if desired. The choice of how to color the projected LiDAR points can have a profound effect on the usefulness and readability of the LiDAR overlays at different distances in the image. The one implemented in the script linearly maps the distances to values between 0 and 1 and then passes it through the ”activation” function tanh(3 ∗ x) to map it logarithmically to the color map ”jet”
Open a new scalabel project, choose "Images" and "Tagging" and use the config files provided by the previous step.
The attribute options available to the labeler can be defined in a separate attribute configuration file. The modification to Scalabel expects the first attribute in this file to be the "Candidate" toggle switch, to allow it to interact with it with the keyboard shortcut [V] key. Once the candidates are selected, the labeler can export the data in the dashboard and move to the next step of the process.
The data needs some intermediary processing for which a script is provided. scalabel/tools/Step_3_Intermediary_Processing.py. Call it like this:
python scalabel/tools/Step_3_Intermediary_Processing.py {data_folder path} {config_file generated by scalabel path} {Main_config.json file path from Step 1} {watermark png file path}In this step the images that are not candidates are water marked as such to ensure that (potentially) third party labelers do not accidentally waste time labeling the wrong images. Further it generates a new configuration file to be used to open the next project in Scalabel in the next step
The overlays generated in the pre-processing can be overlayed over the RGB image. Using the number keys ([1] key, [2] key, [3] key,...) various overlays can be turned on and off. The default pre-processing script puts the LiDAR overlay on the [1] key and the event camera overlay on the [2] key.
Using the [Y] key and [M] key the transparency of the overlay can be modified up and down respectively. This can be especially handy if an additional overlay was added in pre-processing displaying the same scene in better weather conditions.
When BEV radar data is available Scalabel will display it to the right of the main labeling window displaying the RGB image. The labeler can click anywhere on the radar BEV and a projected corresponding pillar will appear on the RGB image as an overlay. This overlay can be toggled using the [9] key once a pixel was selected for the first time in the bev. This can be useful to find the location of street borders or walls or the dimensions of a car.
To adjust the Intrinsics and extrinsics used for this projection. Navigate to the file: app/src/components/sensor_overlay.tsx:170
Scalabel is currently supported by ETH VIS Group. Many contributors have contributed to the project.