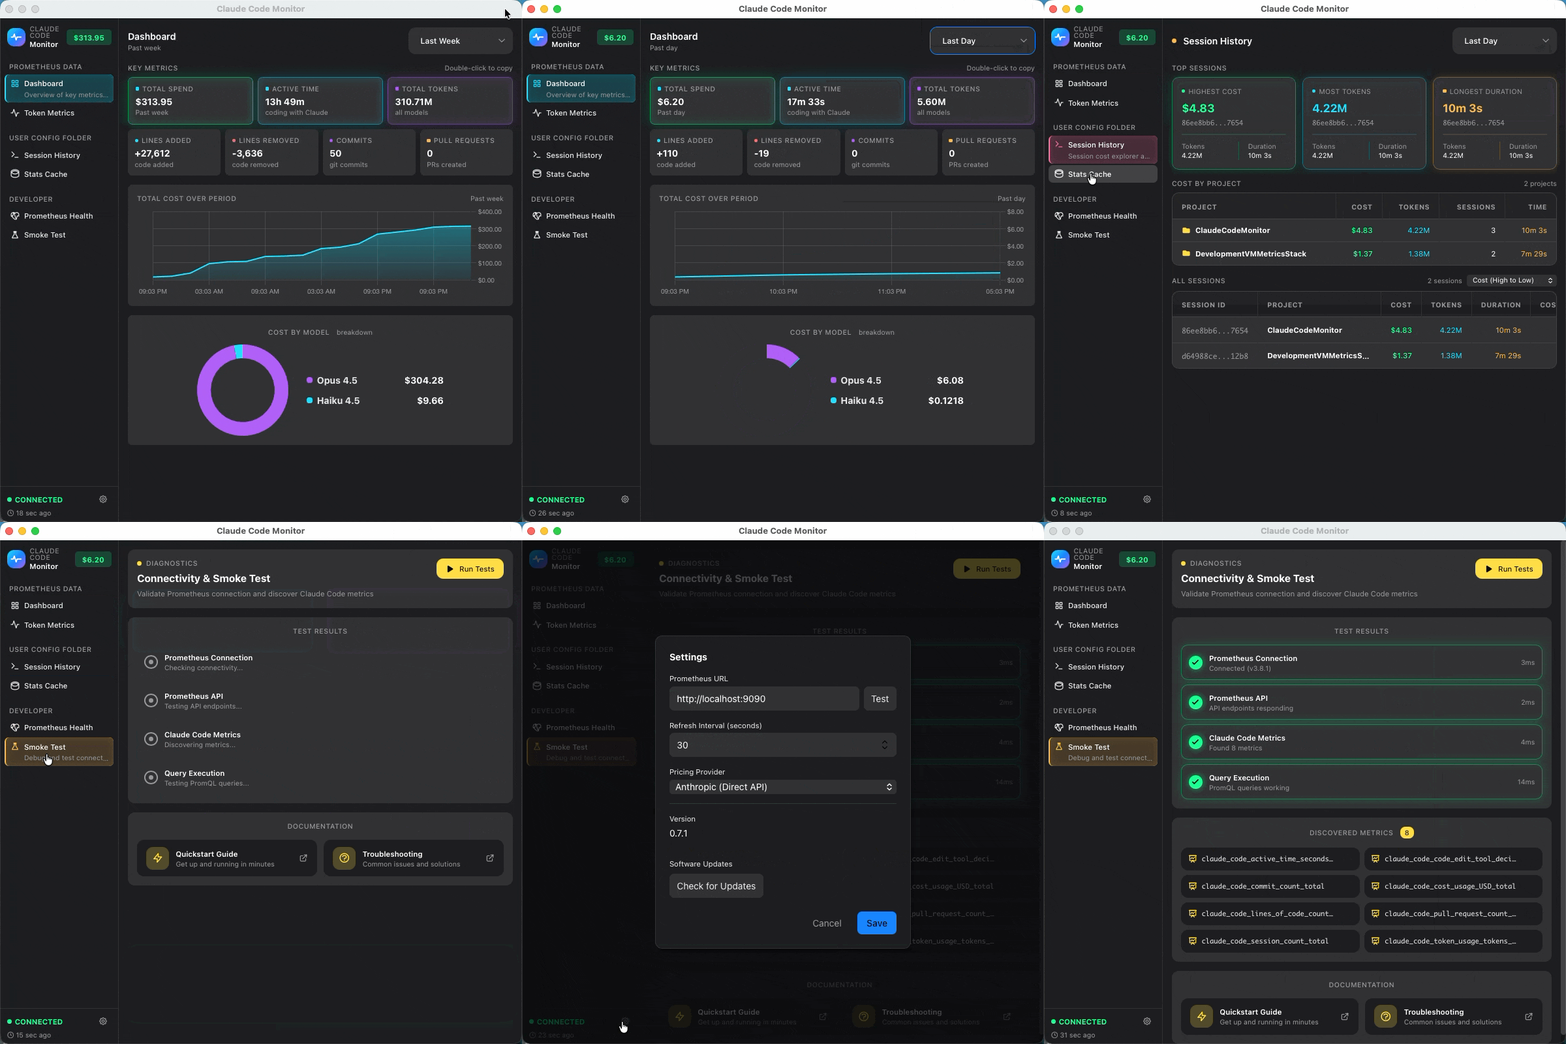
A cross-platform desktop application for monitoring Claude Code usage via Prometheus telemetry. Runs on macOS, Linux, and Windows.
- Summary Dashboard - Real-time KPIs with cost tracking and model breakdown
- Token Metrics - Token usage by model and type (input/output/cache)
- Insights - Usage trends, comparisons, and productivity metrics
- Sessions - Cost by session and project analysis
- System Tray - Quick stats at a glance
- Auto-Updates - Stay current with automatic update checks
Install Podman Desktop for your platform (macOS, Linux, or Windows).
Clone the repository and start the monitoring stack:
# Clone the repository
git clone https://github.com/cragr/ClaudeCodeMonitor.git
cd ClaudeCodeMonitor

# Initialize Podman (macOS/Windows only)
podman machine init
podman machine start

# Start the stack
podman compose up -d
Verify: Open http://localhost:9090 to see Prometheus.
If the default ports (4317, 4318, 8889, 9090) conflict with other services, run the configuration script:
# macOS / Linux
./scripts/configure-ports.sh

# Windows
.\scripts\configure-ports.ps1
The script prompts for new port numbers, validates them, and restarts the stack. If you change the Prometheus port (default 9090), update the app settings: Settings → Prometheus URL.
Add to your shell profile (~/.zshrc or ~/.bashrc):
export CLAUDE_CODE_ENABLE_TELEMETRY=1
export OTEL_METRICS_EXPORTER=otlp
export OTEL_EXPORTER_OTLP_PROTOCOL=grpc
export OTEL_EXPORTER_OTLP_ENDPOINT=http://localhost:4317
Reload your shell and verify:
source ~/.zshrc  # or ~/.bashrc
echo $CLAUDE_CODE_ENABLE_TELEMETRY # Should output: 1Add to your PowerShell profile ($PROFILE):
$env:CLAUDE_CODE_ENABLE_TELEMETRY = "1"
$env:OTEL_METRICS_EXPORTER = "otlp"
$env:OTEL_EXPORTER_OTLP_PROTOCOL = "grpc"
$env:OTEL_EXPORTER_OTLP_ENDPOINT = "http://localhost:4317"
Or set system-wide via Settings → System → About → Advanced system settings → Environment Variables.
Reload PowerShell and verify:
. $PROFILE
$env:CLAUDE_CODE_ENABLE_TELEMETRY # Should output: 1Download a release:
Go to Releases and download:
| Platform | Download |
|---|---|
| macOS (Apple Silicon) | Claude.Code.Monitor_x.x.x_aarch64.dmg |
| macOS (Intel) | Claude.Code.Monitor_x.x.x_x64.dmg |
| Windows | Claude.Code.Monitor_x.x.x_x64-setup.exe |
| Linux (Debian/Ubuntu) | claude-code-monitor_x.x.x_amd64.deb |
| Linux (Fedora/RHEL) | claude-code-monitor-x.x.x-1.x86_64.rpm |
| Linux (Universal) | Claude.Code.Monitor_x.x.x_amd64.AppImage |
Or build from source: See BUILD.md.
-
Run Claude Code to generate some metrics:
claude
-
Open the app and go to Smoke Test in the sidebar
-
Click Run Tests - all tests should pass (green checkmarks)
Troubleshooting:
- Ensure the monitoring stack is running:
podman compose ps - Check Prometheus targets: http://localhost:9090/targets
- See Troubleshooting for common issues
To avoid manually starting the monitoring stack after each reboot, configure Podman Desktop to start automatically:
- Open Podman Desktop
- Go to Settings (gear icon) → Preferences
- Enable "Start Podman Desktop on login"
- In Podman Desktop, go to Settings → Resources
- Find your Podman machine (e.g.,
podman-machine-default) - Enable "Start engine when Podman Desktop starts"
Containers with restart: always (set in compose.yaml) need additional configuration to start automatically when the Podman engine starts.
macOS / Windows:
Open your terminal (bash or PowerShell) and connect to the Podman VM to enable the restart service:
podman machine ssh
systemctl enable podman-restart.service
exit
Linux:
Enable lingering for your user to allow rootless containers to run automatically:
sudo loginctl enable-linger $USERWith all settings enabled, the monitoring stack will be available automatically after login.
| Document | Description |
|---|---|
| Architecture | Technical overview |
| Troubleshooting | Common issues and solutions |
| BUILD.md | Build from source |
| Metric | Description |
|---|---|
claude_code_token_usage_tokens_total |
Token consumption |
claude_code_cost_usage_USD_total |
Cost in USD |
claude_code_active_time_seconds_total |
Active coding time |
claude_code_session_count_total |
Session count |
claude_code_lines_of_code_count_total |
Lines added/removed |
claude_code_commit_count_total |
Git commits |
claude_code_pull_request_count_total |
Pull requests |
- Framework: Tauri 2 (Rust + Web)
- Frontend: Svelte 5 + TypeScript + Tailwind CSS
- Charts: Chart.js
- Containers: Podman + Podman Desktop
MIT
