


Query and visualize CrateDB in Grafana over the PostgreSQL wire protocol —
time-series panels, cluster monitoring from the sys schema, logs in Explore, alerting,
annotations, and dashboard variables.
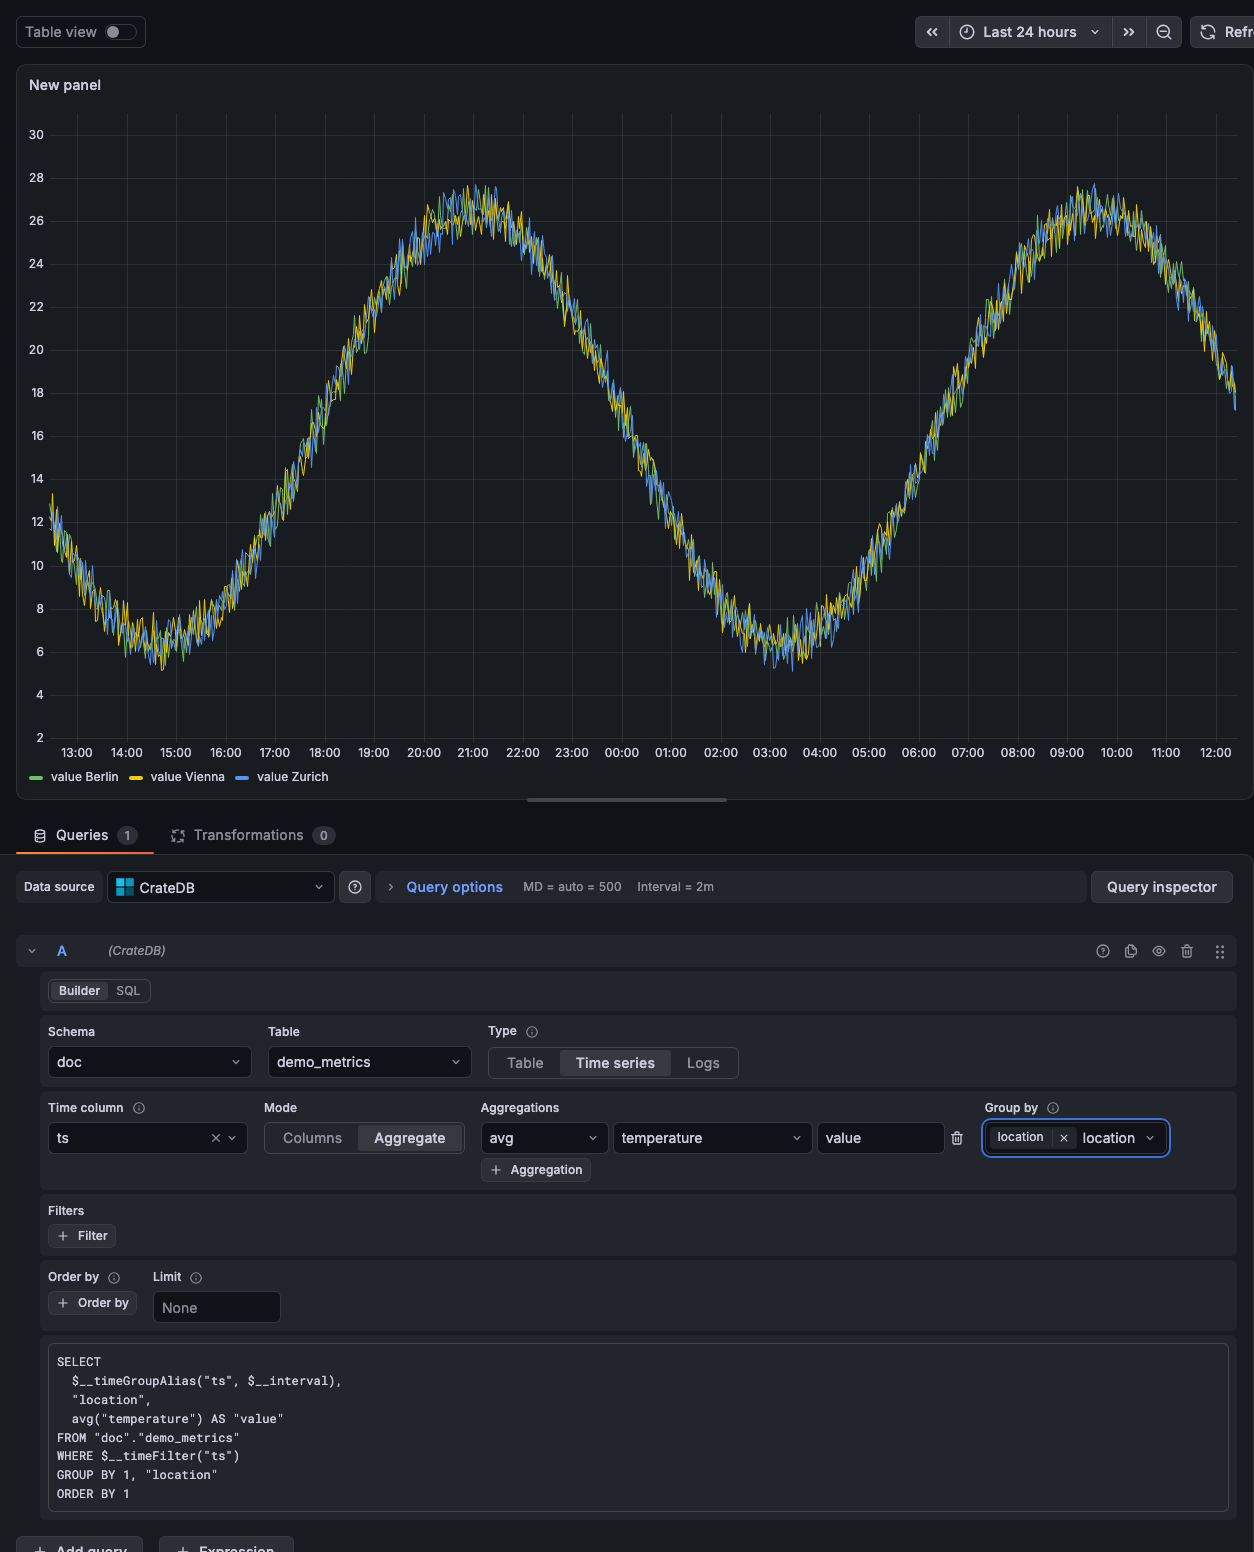
Pick a table and the visual query builder completes the time-series query CrateDB wants,
DATE_BIN bucketing and partition-pruning time filter included:
Early release. Version 0.1.0 is the plugin's first public version. It is exercised by an automated test suite against several CrateDB and Grafana versions, but it has not yet seen wide production use — bug reports and feedback are especially welcome.
- Visual query builder and SQL, both ways. New queries open in a builder with Table, Time series and Logs flavors — schema and table pickers, typed filter rows, aggregations with grouping, ordering and limits. Switch to SQL to edit by hand and back again: builder state travels with the query, and hand-written SQL that fits the builder's model converts back into builder state.
- A SQL editor that knows your cluster. Schema, table and column autocomplete from
information_schema(includingsys), macro completion and hover documentation, an in-editor cheat sheet, and Ctrl/Cmd+Enter to run. - CrateDB-native time-series macros.
$__timeGroupbecomesDATE_BIN, time filters become millisecond-precision literals. Macros resolve on the backend, so alert rules expand them the same way panels do. - Cluster monitoring with no exporter. The bundled CrateDB Cluster Health dashboard reads
sys.nodes,sys.shardsandsys.jobs_logdirectly. - CrateDB types, modeled.
OBJECTcolumns surface as structured JSON a table panel can inspect cell by cell; arrays,GEOandFLOAT_VECTORcome through in their CrateDB text form rather than as errors. - Template variables and ad-hoc filters. Variable queries get the full SQL editor; dashboard-wide filters offer only columns that can back a valid CrateDB predicate.
- Diagnostics that name the fix. Authentication, TLS, network and timeout failures come back as actionable messages, and the config page catches the classic mistake of pointing at CrateDB's HTTP port instead of the PostgreSQL one.
Two dashboards ship with the plugin.
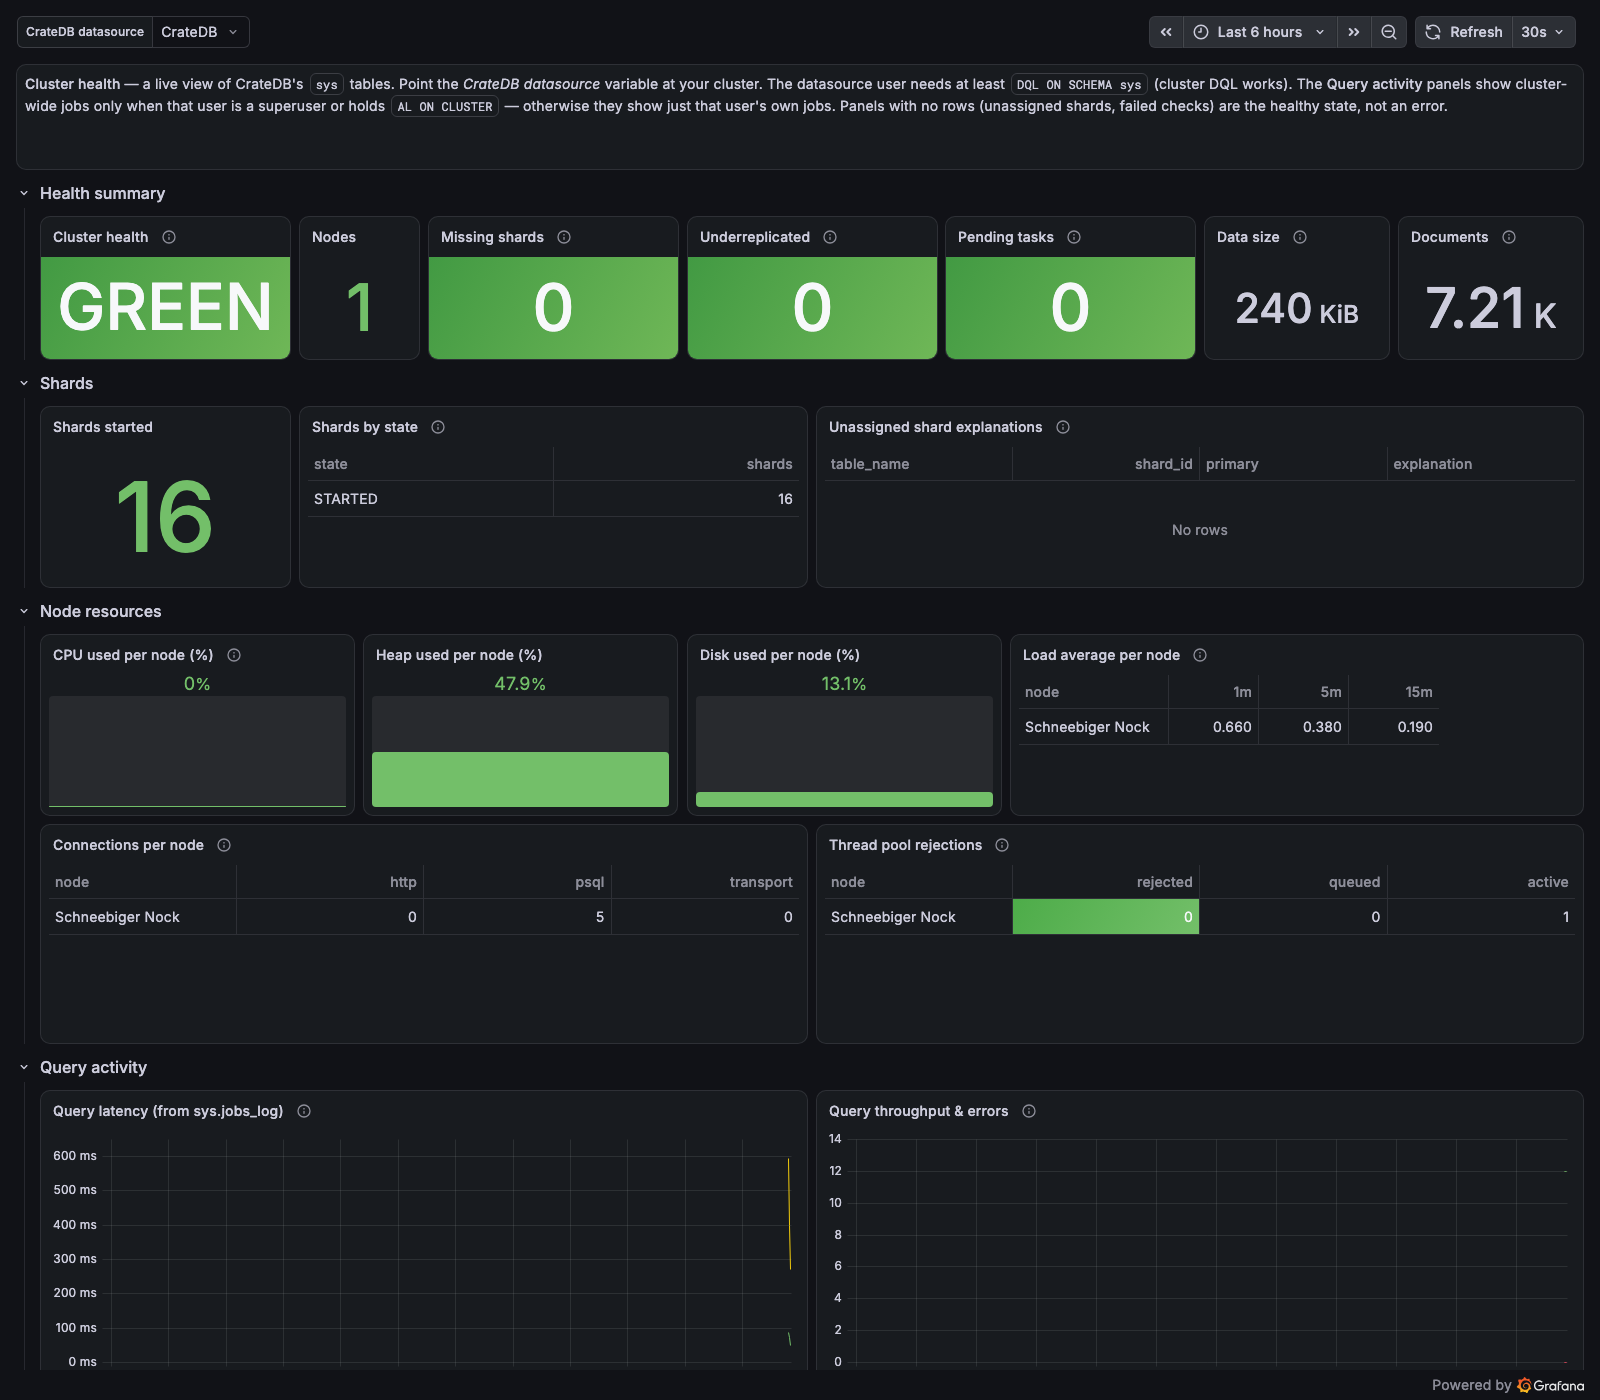
CrateDB Cluster Health — nodes, heap, disk, shards and query latency, read straight from sys.
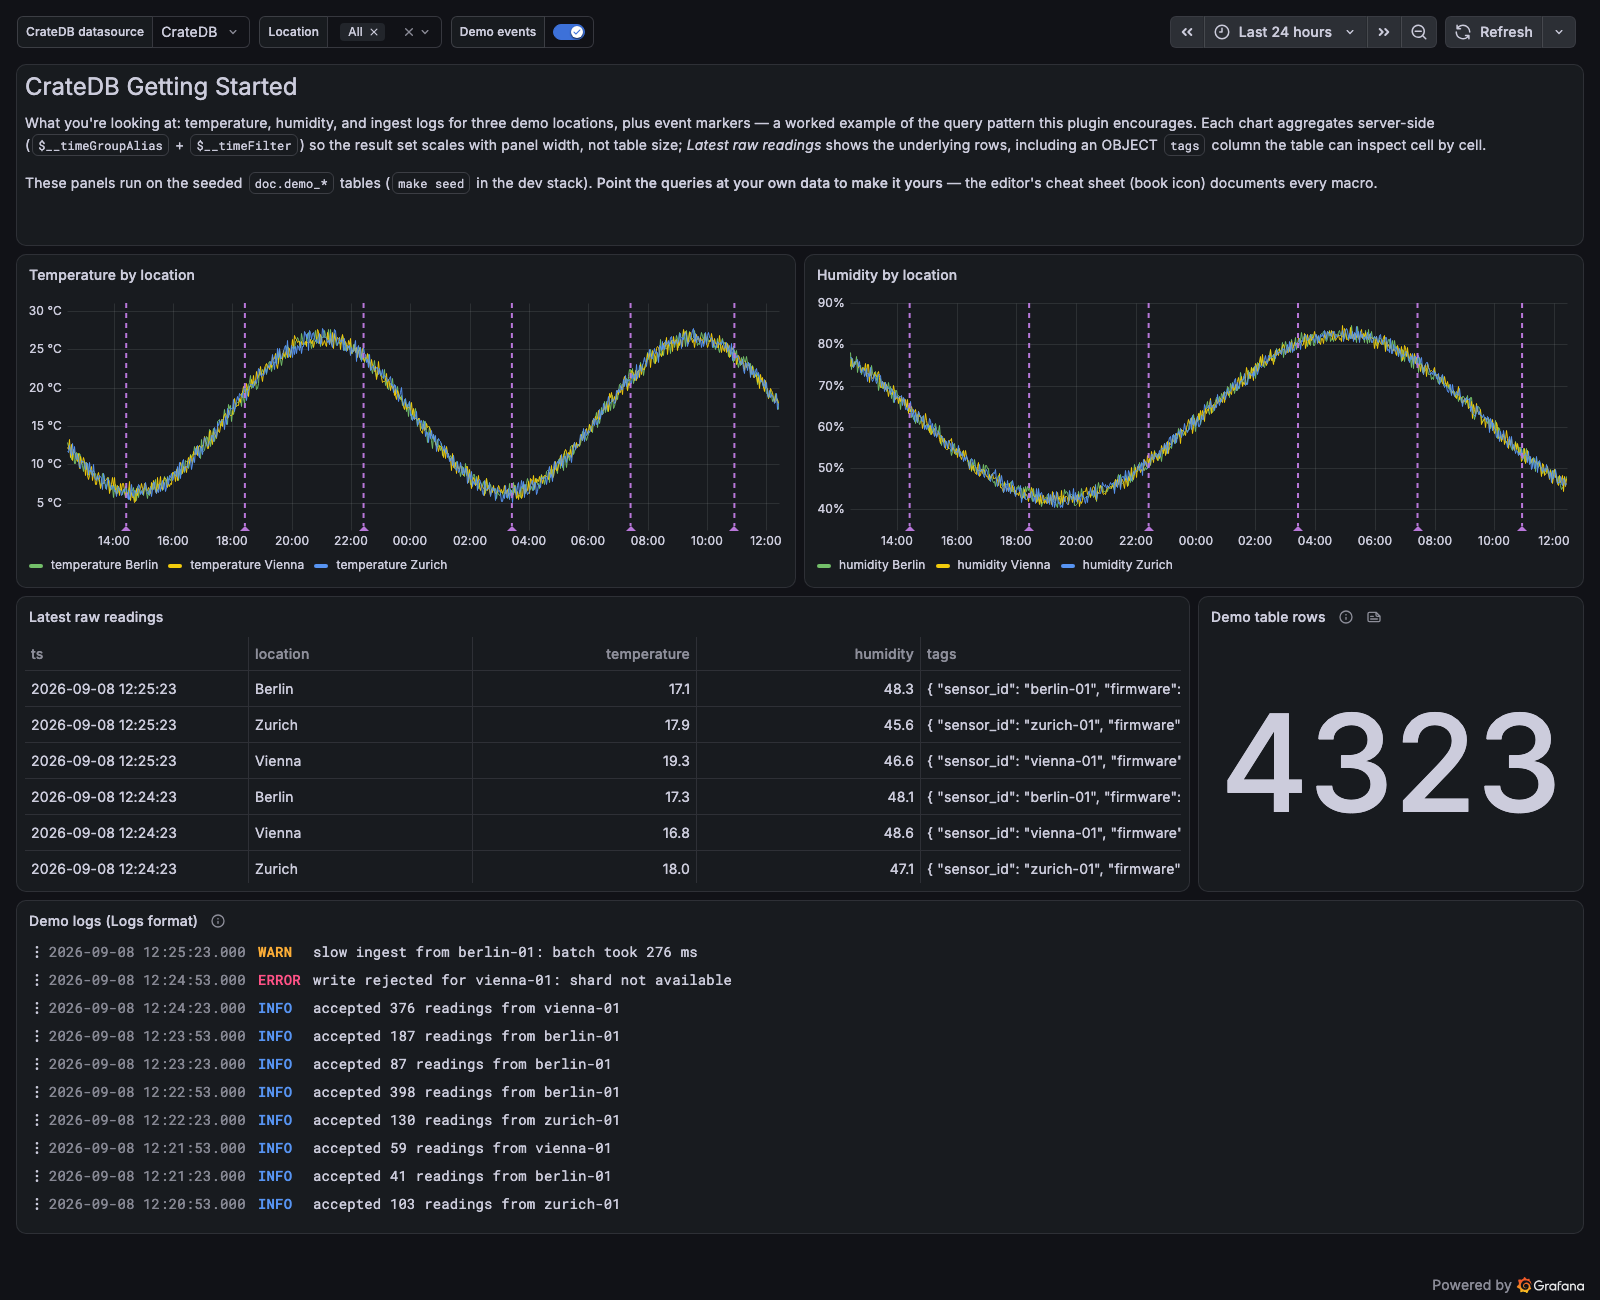
CrateDB Getting Started — the recommended query pattern end to end, including an OBJECT
column, a logs panel and annotations.
- Grafana 12.3 or later. The frontend uses the host's React through the shared
react/jsx-runtimeexternal (React 18 on Grafana 12.x, 19 on 13.x) rather than bundling its own; 12.3 is the first version to provide it. - CrateDB 4.7 or later, with 6.3 and later covered by CI.
$__timeGroupexpands toDATE_BIN, which CrateDB added in 4.7; on an older cluster, bucket by hand withFLOOR(EXTRACT(EPOCH FROM ts)/N)*N, which yields epoch seconds rather than a timestamp. Nothing else in the plugin sets a floor: introspection readsinformation_schemadirectly. (Grafana's built-in PostgreSQL data source needsparse_ident()and therefore CrateDB 6.3 or later; this plugin does not.)
The plugin is not yet listed in the Grafana plugin catalog, so it installs from a release archive and Grafana has to be told to load it unsigned. That works on self-hosted Grafana (OSS or Enterprise); Grafana Cloud does not run unsigned plugins, and offers no override.
Install on self-hosted Grafana
-
Download the archive from Releases and extract it into Grafana's plugin directory (default
/var/lib/grafana/plugins). -
Allow the plugin id — in
grafana.ini:[plugins] allow_loading_unsigned_plugins = cratedb-cratedb-datasource
or, for the Docker image:
GF_PLUGINS_ALLOW_LOADING_UNSIGNED_PLUGINS=cratedb-cratedb-datasource -
Restart Grafana.
The plugin page carries an unsigned badge, and updates do not arrive through the Grafana UI — watch this repository's releases. Grafana's plugin signatures documentation covers the mechanics.
Why unsigned, and what about Grafana Cloud?
Grafana's plugin policy places a plugin offered by a for-profit business at the Commercial signature level, which requires a paid Commercial Plugin Subscription with Grafana Labs. That isn't in place yet. Until it is, there are no signed builds, and so no Grafana Cloud support either.
Private signing is
tied to a single instance's root_url and accepts no wildcards, so no build can be pre-signed for
everyone. Where a security policy demands a signature, sign the plugin against your own instance
with a free Grafana Cloud token.
If Grafana Cloud support matters to you, say so in an issue — demand is what would justify a signed, catalog-listed release.
1. Install the plugin and restart Grafana.
2. Add the data source at Connections → Data sources → Add data source → CrateDB.
| Option | Default | Notes |
|---|---|---|
| Host URL | — | CrateDB node or load balancer as host:port. Use the PostgreSQL wire port, usually 5432; the HTTP port 4200 speaks a different protocol |
| Default schema | doc |
Applied as search_path. doc is where CrateDB puts tables created without a schema, but tables can live anywhere |
| Username | crate |
|
| Password | empty | Optional — CrateDB's Docker default is trust authentication |
| TLS/SSL Mode | disable |
disable, require, verify-ca, verify-full |
| TLS/SSL Method | certificate content | Paste PEM content (stored encrypted), or give paths to certificate files readable by the Grafana server |
Under Additional settings: connection limits, timeouts, autocomplete cache TTL, secure SOCKS proxy, and a row limit. The row limit caps how much of a result set reaches Grafana; it does not stop CrateDB from executing an expensive scan or aggregation server-side.
A panel can run any SQL the connected user is allowed to, including writes and DDL. Connect with a
read-only user — GRANT DQL ON SCHEMA doc TO grafana;.
3. Build a query. New panels open in the builder. Choosing a table is enough to produce the recommended aggregation — the time column is inferred from the table's metadata:
SELECT
  $__timeGroupAlias("ts", $__interval),
  count(*) AS "value"
FROM "doc"."demo_metrics"
WHERE $__timeFilter("ts")
GROUP BY 1
ORDER BY 1
Bucketing by $__interval server-side keeps the result set proportional to panel width rather
than to row count, which is what makes panels over large tables viable. $__timeFilter is what
lets CrateDB prune partitions.
The result format follows the builder flavor you pick. In the SQL editor it defaults to Auto:
a time series when the first column is aliased time (or uses $__timeGroupAlias) and more
columns follow, a table otherwise. Override with Time series, Table or Logs at any time.
4. Browse logs in Explore with the builder's Logs flavor, which offers time, message and
severity column pickers, or in SQL by aliasing columns to time, body and optionally level.
5. Open the bundled dashboards. CrateDB Cluster Health and CrateDB Getting Started ship with the plugin and appear under the data source's Dashboards tab.
To see all of it running against seeded demo data without installing anything but Docker, follow Try it locally.
- Macros — the full set, what each expands to, and the query templates
- Template variables and ad-hoc filters
- Annotations — the columns an annotation query has to return
- Provisioning — configuring the data source from a YAML file
- Why this plugin and not the PostgreSQL data source?
- Roadmap — what 0.2 is planned to bring, and why each item is not here yet
- CrateDB documentation
- Development — building, the test tiers, the dev stack, CI
- Architecture — how the plugin is put together and how it is verified
Bug reports, feature requests and pull requests are all welcome. The issue forms ask for exactly the details that make triage fast — the plugin/Grafana/CrateDB version triple and the executed query. If you are not sure something is a bug, the CrateDB community forum is a good first stop.
See CONTRIBUTING.md for the CLA and pull-request conventions, and SECURITY.md for reporting vulnerabilities privately.
Apache-2.0. Adapted from the QuestDB, ClickHouse and Redshift Grafana data source plugins — see NOTICE for what came from where.