Repository navigation
Visualize sonar data as a stack of cards/data cube #17
Description

For sonar data from a stationary platform in the ocean (often called a "mooring"), we can see movements of animals up and down the water column according to the daylight cycle.
The data cube representation basically plots 1 image for each day, from this type of sonar time series, and arrive at the following figure:

Data Cube Representation of Time Series Illustrating Seasonal Variations
(Image from ASL Environmental Sciences https://aslenv.com/AZFP-data.html)
It will be cool to have this in echoshader!
We can have widgets to interactively control the time span, which frequency to plot, colormap, etc.
Activity
[-]Visualize sonar data as a stack of cards[/-][+]Visualize sonar data as a stack of cards/data cube[/+]ldr426 commentedon Mar 15, 2022
demo_example.mp4
Hi, mentors. It is not hard to control frequency or colormap by using panel, but it may get conflict when setting time as x-axis and controlling time-span at the same time. I am trying to solve this problem.
ldr426 commentedon Mar 15, 2022
Is time range-slider better? Or normal slider to choose fixed time span like one day?
leewujung commentedon Mar 16, 2022
@ldr426 : cool! I am thinking the beginning and ending date is fixed depending on the input data, but then where the open face is "slices out" depends on a single date, so it seems that a normal slider would work. Thoughts?
In terms of controlling the x-axis (assuming in the context of this data cube), the front face should always have the same x-axis since it is always a 24-hr period, and y-axis be along the same depth, but the y-z plane would have different length depending on the start/slice/end dates.
ldr426 commentedon Mar 16, 2022
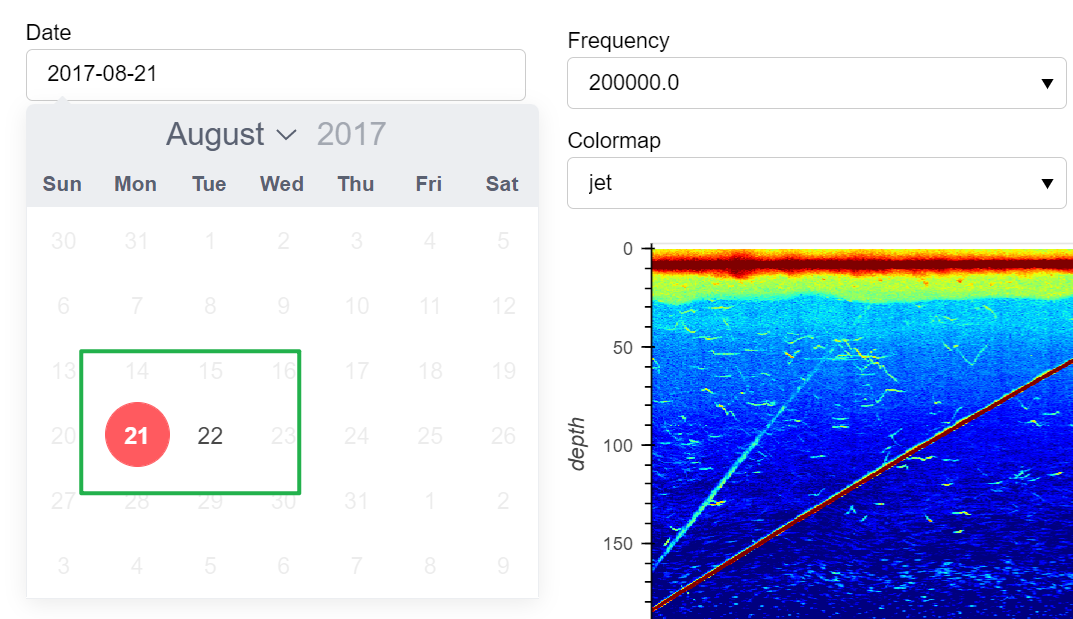
@leewujung : got it! How about using DatePicker? It can fix start/end date, then limit the dates that can be selected. As shown below, I set start/end date according to ping_time input. It is much more convenient to use DatePicker than normal slider, I think.
leewujung commentedon Mar 16, 2022
@ldr426: I think date picker is a good idea.
One thing that this does not have though is the top face of the data cube, where you can see the sandglass shape of colors -- these are how the animal migration wrt sunlight hours changes over season, the diel vertical migration (DVM).
Your suggestion makes me think that a way to get this may be to plot the top surface (dimension: 24 hr x total number of days selected) as a component, and then DatePicker can be used to plot a line on where the date is on that, and in another component have the echogram you already have.
ldr426 commentedon Mar 17, 2022
@leewujung wow!
Does plotting the top face mean we only consider "the top", like depth=0m or -5m, near the sea surface?
The new component can use scatter plot, whose y-axis is date and x-axis is 24-hour. If Sv values > -75, then can be put on the plot. Or line plot better?
leewujung commentedon Mar 17, 2022
Actually this is interesting -- this will be cool thing, to visualize how the DVM sandglass shape at different depth! So then you can slice the original cube either along depth like what you said, and also slice it along date, like the original thought.
Scatter plot is an interesting idea: What if for Sv > -75 (or some other threshold) you scale the size of the scatter points with the Sv value? Might be good to use something like
xr.coarsento reduce the number of points if it gets crowded.I wonder if a scatterplot and an image may give different insights to the data!
ldr426 commentedon Mar 17, 2022
@leewujung Thank you for answering.
yeah, it would be cool to scale the size of points according to values.
Now it is much more interesting and challenging. I will try it! 😃
ldr426 commentedon Mar 17, 2022
@leewujung already finished datepicker, frequency and colormap part.
I will do more work for Diel vertical migration (DVM) and design a more beautiful interface before pulling request for this issue.:runner:
ps: I just use two consecutive hours(23-0,0-1) from two consecutive days as data input, so x-axis doesn't show 24-hour. Also some data before 24:00 in raw data are vacant. When using enough big and complete data, it will show a whole day.
_2022_03_17_19_40_57_122.mp4
leewujung commentedon Mar 21, 2022
Yes, that is true. The instrument had a small off period before midnight each day.
leewujung commentedon Mar 21, 2026
Re-open as this was not actually completed.
leewujung commentedon Aug 4, 2026
Closing this as it is tracked in #239.