


A library to calculate thermodynamic equilibria and plot phase diagrams of binary alloys in the (semi-)grand ensemble.
You supply a free energy model for each phase — analytic toy models, CALPHAD-style parametrizations, or interpolations of computed free energy data — and landau finds the stable phases, refines the phase boundaries and draws the diagram.
pip install landauPhases are defined by their free energies. Two ideal solutions — a solid and a liquid — already give a full binary phase diagram:
import numpy as np
from landau import LinePhase, IdealSolution, plot_phase_diagram
from landau.calculate import calc_phase_diagram
from landau.phases import kB

solid = IdealSolution("solid",
    LinePhase("A",    fixed_concentration=0, line_energy=-2.0, line_entropy=1.0 * kB),
    LinePhase("B",    fixed_concentration=1, line_energy=-3.0, line_entropy=1.5 * kB))
liquid = IdealSolution("liquid",
    LinePhase("A(l)", fixed_concentration=0, line_energy=-1.9, line_entropy=2.5 * kB),
    LinePhase("B(l)", fixed_concentration=1, line_energy=-2.9, line_entropy=2.2 * kB))

df = calc_phase_diagram([solid, liquid], Ts=np.linspace(400, 1800, 100), mu=100)
plot_phase_diagram(df)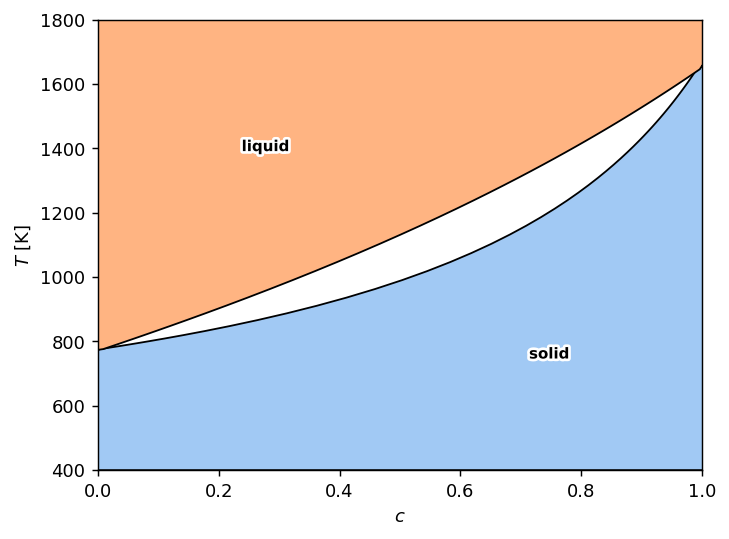
calc_phase_diagram returns a plain pandas dataframe of (T, mu, phase, c, phi)
samples that the plotting functions consume, so intermediate results stay easy
to inspect and post-process.
The same interface works with computed free energies. This Mg–Ca phase diagram is calculated from free energies of an Atomic Cluster Expansion potential, obtained by thermodynamic integration with calphy:
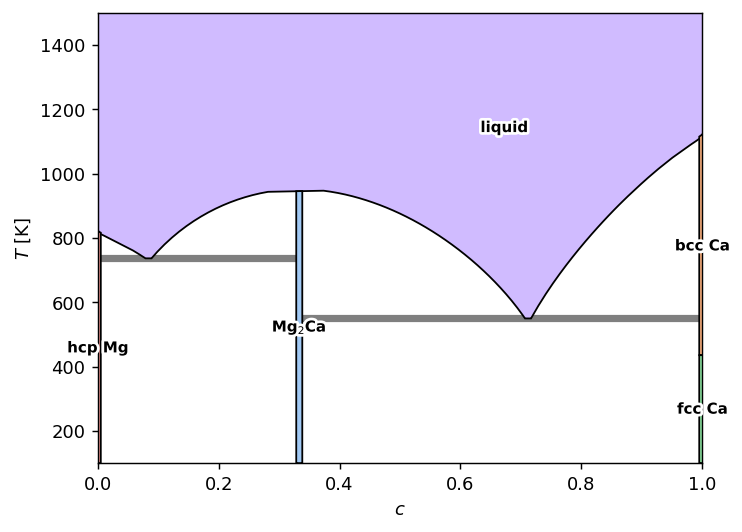
The Mg–Ca worked example goes from raw free energy samples to this diagram.
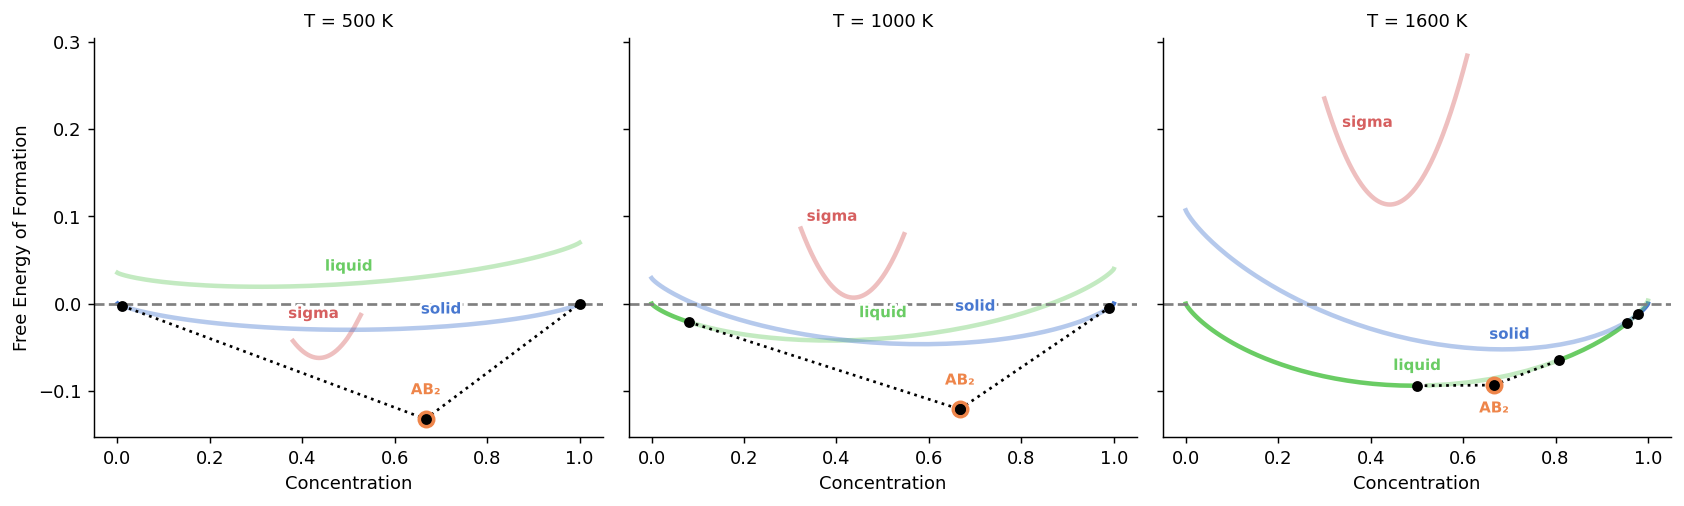
plot_excess_free_energy shows the free energy curves behind a diagram,
including metastable phases and the common tangent constructions that
determine the stable regions:
The documentation walks through the full API, including the basic concepts, congruent and non-congruent melting, stoichiometric line compounds and point defects.
This code is part of a publication, please cite it accordingly if you use this package in your work
@article{poul2025automated,
    title = {Automated generation of structure datasets for machine learning potentials and alloys},
    journal = {npj Computational Materials},
    author = {Poul, Marvin and Huber, Liam and Neugebauer, J{\"o}rg},
    volume = {11},
    number = {1},
    pages = {174},
    year = {2025},
    doi = {10.1038/s41524-025-01669-4},
}