Home
Visualization is an application for real-time monitoring and control. To achieve this, it uses several types of widgets:
- Virtual instruments, for showing monitored values. These include instruments such as analog, digital, time plot, two axis plot, led instrument, etc.
- Controls, for sending commands. Only action button is supported at the moment.
- Statics, for showing predefined images
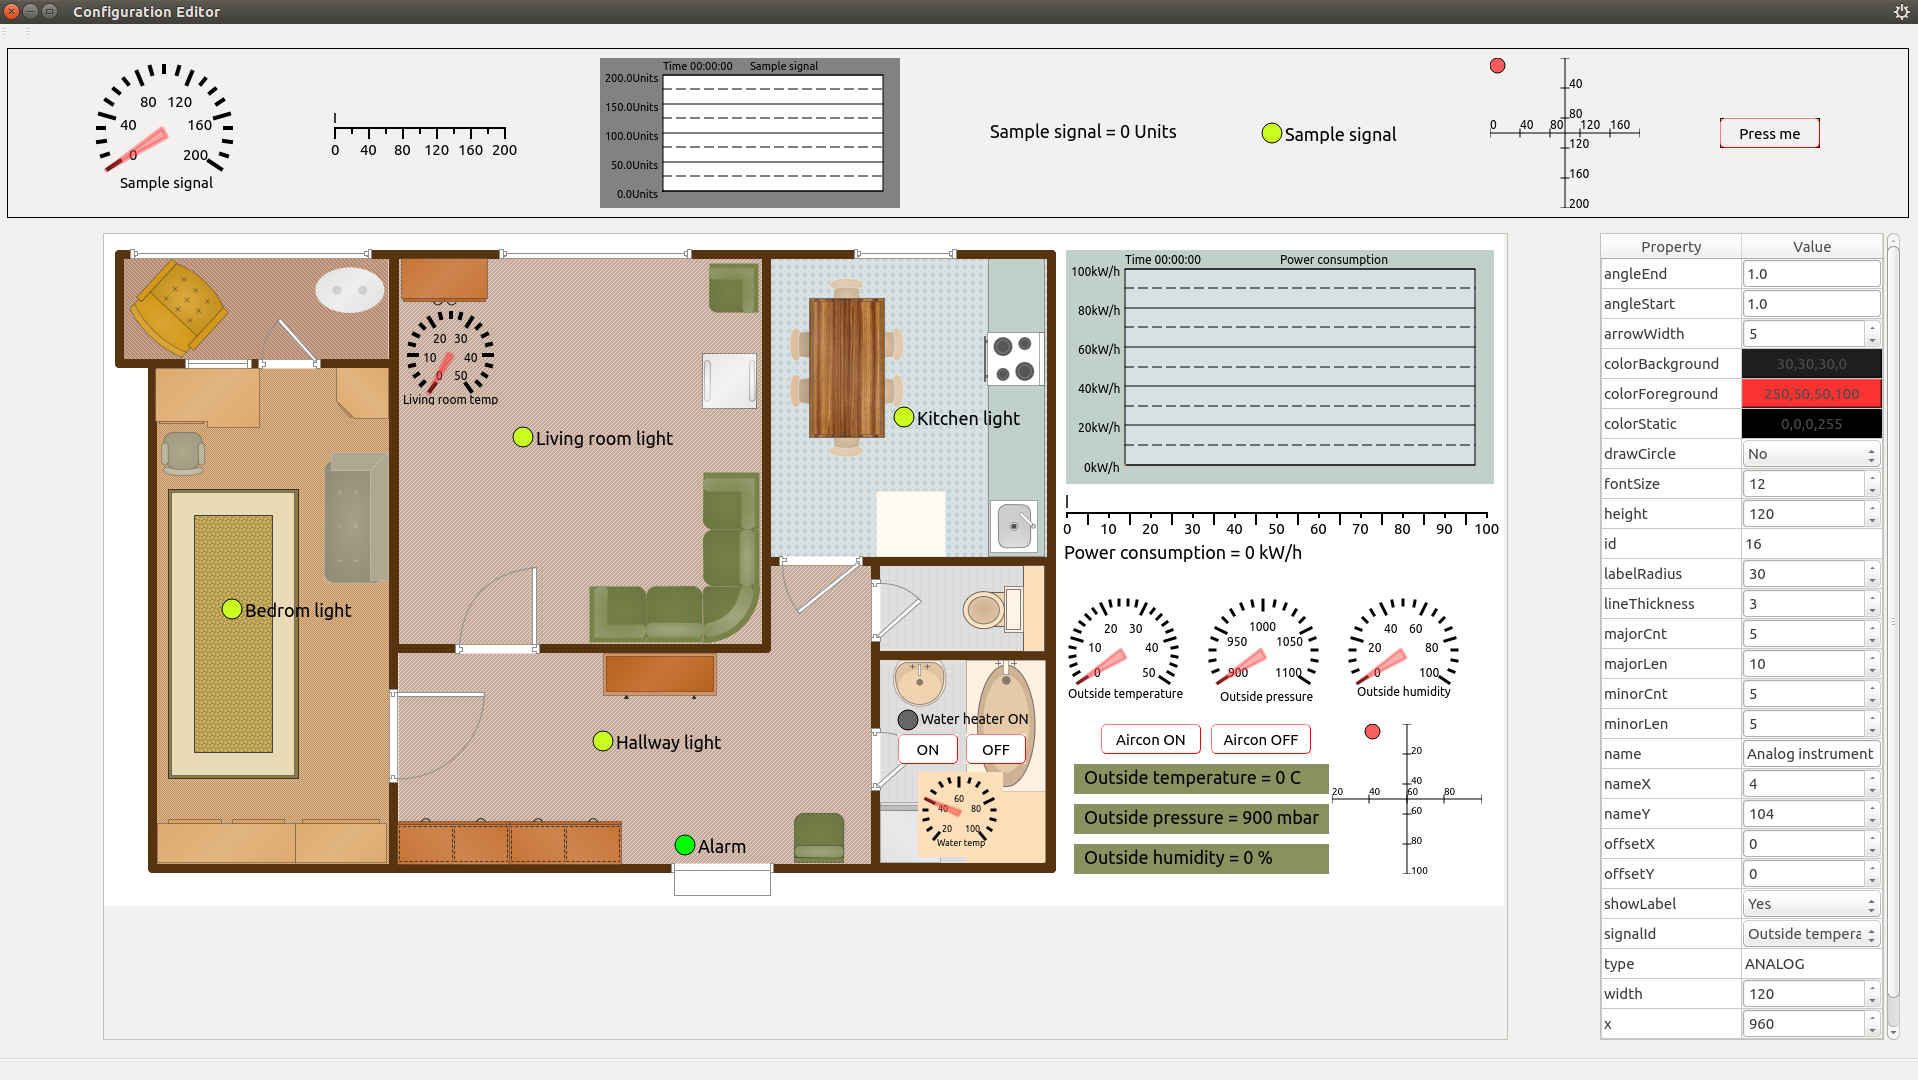
Layout and properties of these components are loaded from configuration xml file during run-time. Application also includes WYSIWYG configuration editor to efficiently edit any aspect of configuration.
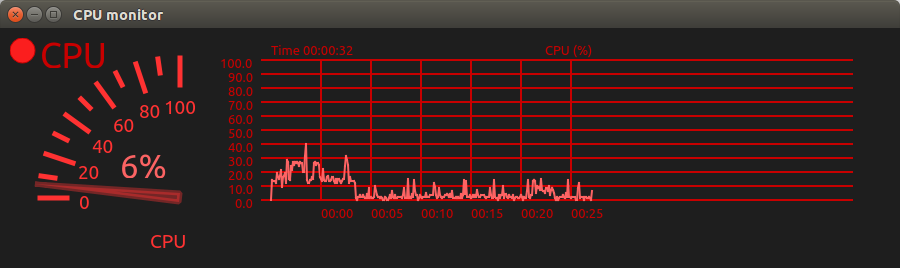
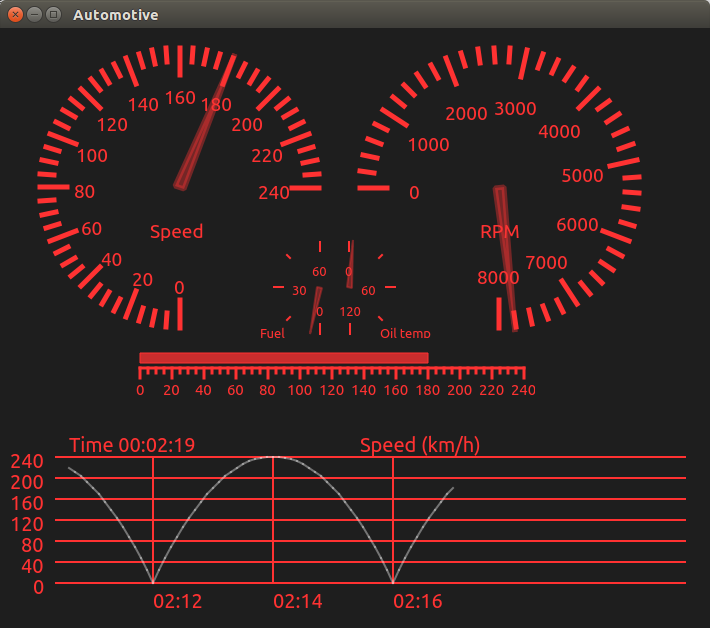
Following are two examples of different configurations. Both use exactly the same binary executable, the only difference is that different configuration xml file is used. This allows for very flexible run-time configuration.
Configurations are defined through xml file. File path to the xml file is given as a first command line parameter. If file path is missing, application will start in WYSIWYG editor mode. Configuration consists of several important sections: basic configuration properties, list of signals and list of widgets (instruments, controls and statics).
Configuration editor mode allows for loading existing configuration, adding and editing of signals and widgets. Example of editor in action can be seen in action in the following image.
Signals describe values measured and send for visualization. Each signal must have unique id, which will be used by the instrument to specify which signal is being monitored. Signals are sent via their raw values. To convert raw value into usable form, signal is multiplied by factor, and then offset is added. Factor and offset values are defined for each signal. This enables application to use simple unsigned integers to transfer values, instead of using floats which may not be supported by some micro controllers. Also, as signal real value calculation is done on the application, this can simplify micro controller code implementation: for example, micro controller can send raw values received from ADC directly to the visualization server, and let the server handle conversion into user readable values.
This is group of dynamic widgets that reflect signal state. Each instrument is connected to at least one signal. Multiple instruments can show values for the same signal. It is possible for one instrument to show values for several signals, but this needs to be implemented in the instrument code. One such instrument is XY plot, which shows values from two different signals on two orthogonal axis.
Controls are widgets that can send messages via UDP protocol. Push button control allows for sending single message when button is clicked, while slider control supports sending unsigned number from predefined range. Destination parameters, such as IP and port in case of UDP communication, are specified for each control independently.
These widgets don't change during application execution, for example images and labels. Images are base64 encoded and stored in configuration. This maintains principle that single configuration xml file holds all run-time specific details.
Visualization can receive values on UDP port specified by the tag in configuration. Control buttons are supported so Visualization can also send UDP packets to control particular devices and serve as a control panel.
Structure of UDP package for receiving signal update values is given in the image below.
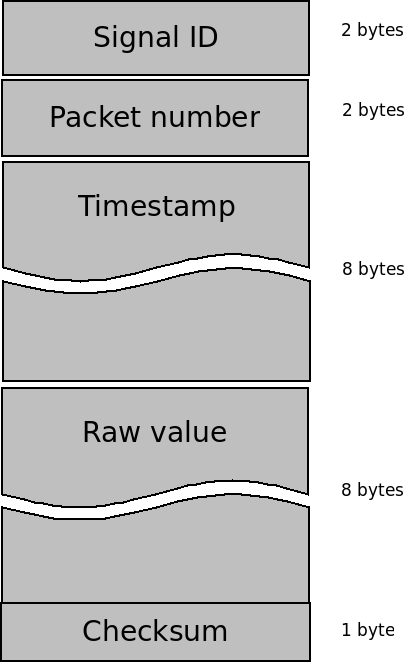
Application also supports serial port communication. To send measured signal value to application, following format is used:
>#SIGNAL_ID,#PACKET_NO,#RAW_VALUE,#TIMESTAMP,#CHECKSUM\r\n
These values correspond to ones defined for UDP packages. Values are actually textual representation of numbers and will be parsed into proper data structure later. This allows for easy integration into existing systems.
Visualization is developed with C++ and Qt. It was initially developed on GNU/Linux machine, however, no system specific features were used. This means that it should be quite easy to port it to different platforms. For desktop platforms (Windows, Mac OSX), it should work out of the box - by simply compiling code for target platform.
-
Open project folder
cd project -
Create Makefile
qmake visualization.pro -
Compile
make
4a. Run with cpu_monitor configuration
`./visualization ../configs/cpu_monitor.xml`
4b. Run in editor mode (default)
./visualization