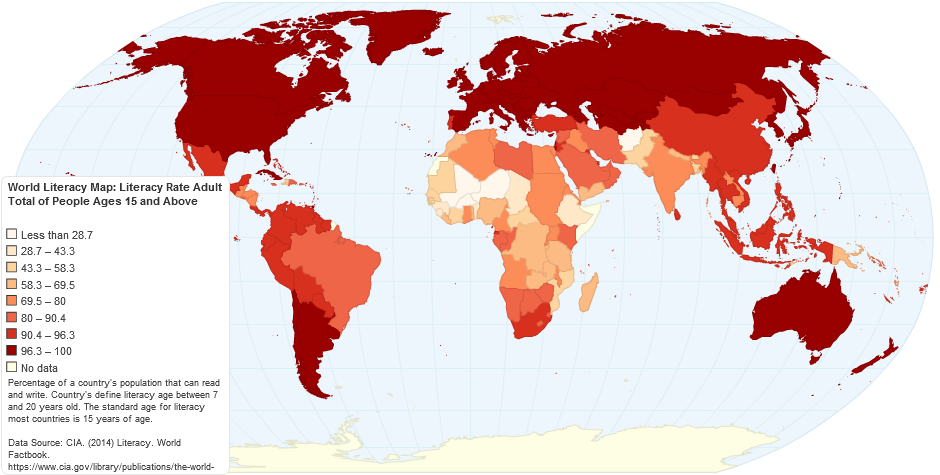
Over the past 65 years, literacy rates have increased globally by 4% every five years. Today, only 14% of the global population remain illiterate. However, in many countries the rates remain unsettlingly low, with the poorest countries having large segments of their population illiterate. This exemplifies huge global inequalities that exist, notably between sub-Saharan Africa and the West.
Within countries that have high levels of basic literacy skills, there remain suprisingly high rates of very poor literacy skills. In England, for example, 1 in 6 adults have poor literacy skills. They can understand short and straightforward texts on familiar subjects, but struggle with unfamiliar sources or topics. Reading instructions on medicines, filling out forms, and making sense of a bus timetable can be very challenging. This is also known as being functionally illiterate and excludes people from many areas of the job market, thus further contributing to inequality.
Our project aims to build awareness about this issue, in a fun and informative way to encourage learning and engagement.
We envision an interactive globe that users can nagivate and move around with ease. Upon entering the website, the user is greeted with a book displaying scrambled letters that merge into a description of the site, with the intention to imitate difficulty in reading. From here, users can click through to the globe. Countries are lit up in brightness that accords with their levels of literacy rates. By hovering their mouse over a country, users can view basic statistics about that country. By clicking on the country, we zoom into a more detailed map and list further, more detailed, information related to that country, for example links to charities and ways to help. There may possibly be a time dimension, where we can view how literacy rates have evolved over time.
Our site is targeted at older children and teenagers, to encourage awareness about the issue. By including playful elements, we aim to get our users engaging with the issue. This will hopefully foster interest in literacy rates, and help our users understand why it is an important topic.
Literacy’s importance cannot be understated. From an individual perspective, low literacy rates can be correlated with worsened job outcomes and lower-earning potentials, and from a national outlook, lower levels of literacy can mar a nation’s economic competitiveness, as well as being linked to drastically lower economic performance metrics such as Gross National Product and Human Development Index.
The goal of this project is to directly convey to our target user group the state of global literacy rates as well as trace its ensuing rise over time through the medium of the web in a way that is more engaging than the typical tabulated data presented by some websites. We intend to add value to the area through creating an engaging and playful educational resource, thus helping to raise awareness and improve understanding of the issue.
To achieve this, we have created a Single Page Application (SPA) designed to show the contrasting literacy levels across the world with the important distinction of being “playful” in its implementation. This gamified approach served as a requirement of the brief and in accordance with this objective, the project’s defining feature is an interactive 3D Globe built using the MEAN stack. MongoDB is used to store literacy rates data whilst Express is utilized to serve that data through an API by listening to requests from the NodeJS runtime. The front-end is implemented using Angular.
We managed the project using Agile methodology, building the bulk of the application across 3 sprints each lasting two weeks. Our team followed a Scrum structure, where there are no hierachies or sub-teams, and we all worked together as a cohesive unit to achieve our objectives.
The high level goals of the project and the contribution towards solving the problem. A checklist against which the team can evaluate their success.
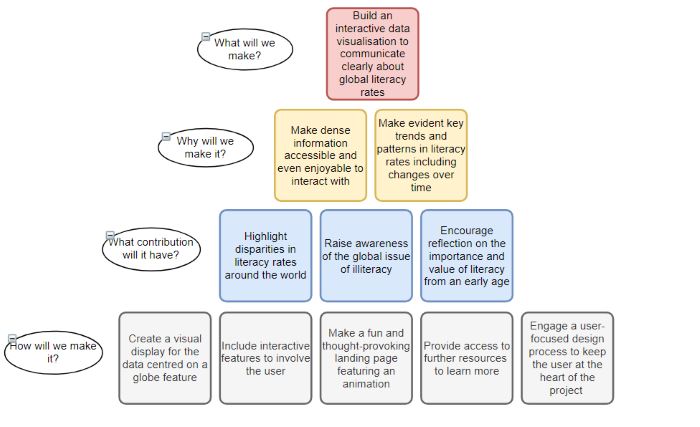
The overarching goal of the project is to build a visualisation of global literacy rates data in order to improve communication of how levels of literacy differ across the world, and how these rates have changed over time. A central goal is to clarify key trends and patterns in the data, and the project aims at once to bring to light the hopeful story of how global literacy has risen over time, and highlight the gaps that remain by making it easier to identify areas where literacy rates remain relatively low. Another high-level aim is to make the information accessible; specifically to make it possible for a user to engage with and discover the data in order to add an element of fun and enjoyment.
By revealing interesting trends in the data, and adding an element of interactive fun, the project seeks to reach more people and retain their attention for longer, make the data easier to digest and understand for those who visit the website, and potentially make the information memorable and more likely to stick in user's minds. In this way, the project seeks to contribute to raising awareness of the issue of illiteracy and access to education more widely, and to bring out contrasts in literacy rates around the world. Targeted to school-aged people, the project seeks to encourage interest in and reflection on the value of literacy and education.

| Team member | Role | |
|---|---|---|
 |
Stanni Lewis | Front-end |
 |
Emily Bloom | Quality Assurance and Testing |
 |
Jessica Woodgate | Database and Back-end |
 |
Wenda Zhao | Back-end |
 |
Hamza Qureshi | Front-end and UX/UI Designer |
- Background literature. Academic research review.
- State of the art survey. Current industry review.
- Clear definition of the problem.
- Stack architecture and system design.
- Back End - MongoDB - database implementation, the data model that we developed our back end from.
- Middle Tier - Express, Node, the RESTful API
- Front End - Angular. Details of implementation.
- Additional elements and components.
- Deployment details (including Docker), include how we achieved continuous integration and deployment.
3. UX Design
- Design Process and Early prototyping and ideation.
- Identification of interacting users and broader stakeholders.
- UX approach – design heuristics/approach, design methods.
- Understanding of user group (questionnaires / user stories / interviews).
- Wireframes and interaction flow diagrams for final key subsystems.
- Group working methods used.
- Discussion of team roles. A summary of individual contributions.
- Documentation of our sprints, including both high level overview, timeline, and selected highlights that were critical points in the project. Summary of meeting logs (including for instance apologies for absence etc).
- Team use of Git, how our team used continuous integration / continuous deployment. Streamlining of workflow throughout.
5. Evaluation
- Details of how we evaluated our designs (techniques used & awareness of their limitations). Description of techniques suitable for our particular design. A timeline of evaluation of our design.
- Unit testing / Functional testing.
- User acceptance testing. Evaluation of our design with users – methods undertaken, findings, implications.
6. Conclusion
- Reflection on the working practices of our group, how well they did or did not work, e.g, management of issues, communication, Agile (etc).
- Reflective discussion of the success of the project.
- Discussion of Social and Ethical implications of our work.
- Discussion of future work (in terms of design, development and evaluation).