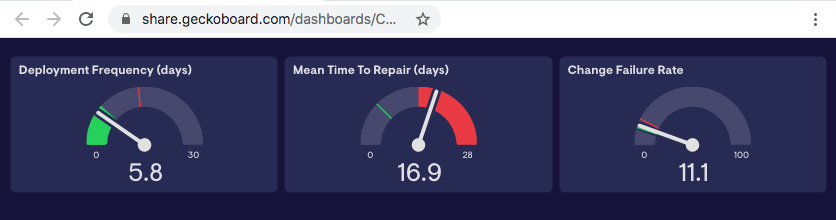
A project to report Software Engineering Metrics like Mean Time To Repair, Deployment Frequency, and Change Failure Rate, using data pulled from Jira, in a dashboard like this one.
Here's a quick index for the rest of this readme to skip to the most relevant section for you.
- Introduction: Where I explain what this project does and why
- Caveats/Motivation: Why the code is as it is, and context for making pull requests
- Approach: To understand why I made the design decisions I did, and to help with changes
- Getting Started: Jump here to figure out how to customize this to your needs
- Prerequisites
- Next Steps: How to improve upon this initial attempt?
- Acknowledgements: Why? That is, why do this project, why are these the right metrics to track?
Best practices in Lean/Agile Software Engineering popularized by paragons of DevOps/Site Reliability Engineering (see Acknowledgements for where I got the inspiration for this project) suggest tracking, and making visible, key metrics around software engineering.
As a software leader, I always wanted a basic dashboard showing these key metrics, namely those of:
- Release Frequency (as a stand-in for Cycle-Time to Release)
- Mean Time to Repair (how long does it take to fix a problem in production?)
- Change Failure Rate (how often does a release to production cause a significant problem?)
(The fourth key metric, Lead Time for Changes, is one Jira is less helpful with, and one which I might add with a separate module looking at commit data.)
In many situations, slowing down or stopping to instrument processes and procedures when the organization is under pressure to deliver can take time or money that you just don't have. This project was born out of the realization that a "KISS" (keep it simple) approach doesn't require a ton of either of them.
Over the past five years, I have only led software teams, rather than been a direct contributor to any of them. While I'm familiar with javascript, the last time I was paid to write javascript code was in 2015, so while while half of the motivation of this project is as captured in the Introduction, I also wanted to refresh my context for the state of, in this case, Node.js development.
Consequently, you might find that the state of the code, the idioms, and patterns used beg for improvement. I welcome pull requests, particularly those with context that help me learn.
I also was seeking to cross the finish line quickly, ane make it applicable to a lot of different contexts. That meant not investing much time in scaffolding like actually deploying these as Lambdas or in a dedicated framework like Serverless or Express. The code should be easy to adapt to such contexts that seems suitable for the expectations/needs you or your team have.
At first my thought was to create some basic API endpoints that could be called from process automation in CICD pipelines, but this seemed to generic and too broad. It would also require instrumentation in many project pipelines.
As I considered the problem, I realized that Jira could easily, and without twisting its core purpose out of shape, be leveraged to produce these metrics, but like any system where Garbage In == Garbage Out, it's necessary to follow some conventions. See "Getting Started" for more details.
Once I had the extraction queries/API calls figured out for Jira, I began to consider data sources. Part of my motivation for this project was to check out time-series databases like InfluxDb or Graphite, but as I considered what kind of dashboard tool to use (e.g. Graphana or build my own?) I realized that the metrics are simple enough, and don't necessarily need historical tracking. In the interest of making this available sooner than later, I found the Geckoboard dashboard tool could do what I want, and even better, there was a simple Google Sheets plugin which could act as a simple JSON data source for the dashboard, so this open source PoC wasn't incurring any long-term hosting/service costs.
In other words, "1.0" of this project could ship once I met the following acceptance criteria:
- Jira issues logged with required fields/releases, following expected conventions
- Code complete with this project
- API endpoint that can serve to populate Google sheets (as a one off for the PoC)
- A Geckoboard dashboard configured to use the Google sheets snapshot datasource
To get the full utility of this project with minimal code changes, you'll need Jira, and the ability to create API tokens.
You'll also need to follow some conventions in Jira to get meaningful results. Chance are you are already following these conventions, but if you aren't, it might warrant some conversations as to why you are not leveraging these important details!
- You must use the "Releases" feature of Jira, and use Semantic Versioning conventions for their names.
- Defects must have an Issue Type of "Bug"
- Enhancements or new feature development should be specified as "New Feature" or "Improvement"
- Defects, particularly Highest or High severity defects, must use both "Fix versions" and "Affects versions" fields.
- New Feature or Improvement issues should use "Fix Version" and must not use "Affects versions" fields
- This is especially crucial if you allow Highest or High priority for issue types of New Feature or Improvement
- The project requires the use of npm modules of axios. After cloning the repo, simply run:
npm install axios - Next, update the placeholder values in start.js lines 5/6 to your Jira project name and API token value
const project = 'YOURPROJECTNAME'; const jiraAuth = 'Basic YOUR_AUTH_TOKEN_FROM_JIRA'; - Presently, the code returns a basic body/response code. You can either run it as is via Node and a basic service handler like serve-handler, or wire it up to a Node/Express app server. Which ever way you go, you'll use the URL to this endpoint when configuring the dashboard API endpoint in the next section.
The simplest option, of course, is just to uncomment the console.log in start.js to get a preview of the stats that this package produces. You can then manually configure a dashboard and shop it around for interest inside your organization before investing in a more permanent/sustainable setup.
This software will generate a JSON object that is consumable by whatever stats/reporting package you choose. As a proof of concept, Geckoboard is simple enough that with a few minutes of configuration, the default JSON output can be configured, using Google Sheets as a basic persistence store.
I suggest starting with Geckoboard/Google Sheets, even if your data is sensitive (just use mock data with the free version until you're ready to wire it up to Jira) just to see how easy it is to wire up. Advanced configurations using a proper database, authentication, etc. is left as an exercise to the reader.
Steps to get started with Geckoboard are simple.
- Create an account
- Click "Add Widget"
- Under "Free Datasources", choose Google Sheets
- Create a Google Sheet document using these instructions
- Set the datasource URL to the API endpoint you configured above
Note that default JSON object returned by this code looks like the following, and the script, when pointed to these metrics, will allow you to point/click configure the widgets to the values that the script updates:
{
    "deployments": 6,
	"deploymentFrequency": 5.8,
	"deploymentFrequencyLabel": "days per release",
	"mttr": 16.9,
	"mttrLabel": "days",
	"changeFailureRate": 11.1
}
Create three widgets in Geckoboard, one each for Deployment Frequency, Mean Time To Repair, and Change Failure Rate. How you configure each widget is up to your tastes, however, my recommended settings are as follows (the labels are json key labels, map their values to the proper UI context):
- Widget 1: "Change Failure Rate".
- Guidance: Wherever your team is right now, set the lower threshold 5% lower, and the upper 5% higher. Keep adjusting to revise your goal state and inspect/adapt until your processes, training, and culture changes trends this in the right direction.
- max: 100
- min: 0
- positiveDirection: down
- lowerThreshold: 10
- upperThreshold: 15
- Widget 2: "Mean Time To Repair (days)"
- Guidance: Scrum/Agile recommends having a potentially shippable increment each sprint, and most teams have 2-week sprints. Your first goal should be to increase your devops chops so you can effectively release to production each sprint (whether you use Feature Flags, Blue/Green, or actually deploy code this frequently, great). So I suggest default values of "green" and value above 14, and red any value below "28". If releasing once a month
is a steep hill for your organization, no shame, just adjust the value to a realistic target for you.
- max: 28
- min: 0
- positiveDirection: down,
- lowerThreshold: 7
- upperThreshold: 14
- Guidance: Scrum/Agile recommends having a potentially shippable increment each sprint, and most teams have 2-week sprints. Your first goal should be to increase your devops chops so you can effectively release to production each sprint (whether you use Feature Flags, Blue/Green, or actually deploy code this frequently, great). So I suggest default values of "green" and value above 14, and red any value below "28". If releasing once a month
is a steep hill for your organization, no shame, just adjust the value to a realistic target for you.
- Widget 3: "Deployment Frequency (days)"
- Guidance: Similar to the previous value, strive to have at least one released version a sprint. If your team is managing to release at least once every three sprints, the max value here may suit you, otherwise adjust it up or down accordingly, and set your lower/upper thresholds to suit your culture and capacity for change.
- max: 42
- min: 0
- positiveDirection: DOWN,
- lowerThreshold: 14
- upperThreshold: 28
- Guidance: Similar to the previous value, strive to have at least one released version a sprint. If your team is managing to release at least once every three sprints, the max value here may suit you, otherwise adjust it up or down accordingly, and set your lower/upper thresholds to suit your culture and capacity for change.
These values will produce a fancy dashboard similar to this.
- Metrics are reported only on a single Jira project.
- Change failures are inferred from meeting all of the following criteria
- Change Failures are those defects whose Priority is either "Highest" or "High"
- Change the JQL in the mttrHandler if you have a higher/lower bar for what constitutes a Change Failure
- The fixVersion field is populated with a SemVer version
- The fixVersion value is equal to a releaseVersion whose status is "Released"
- The sooner you populate these values, the closer your MTTR and Change Failure Rate metrics will reflect reality.
- Change Failures are those defects whose Priority is either "Highest" or "High"
Please note that the assumptions here are in-line with the concepts Atlassian outlines on their tutorial page about versions. If your organization follows a different convention, you'll either need to adjust how this package works, or convince your organization to follow the conventions Atlassian recommends so that default assumptions packages like this one make, work out of the box.
Aside from the tactical problems noted as TODOs in the code, a few key aspects would make this more "complete" from a practical code quality dashboard:
- The metric that is missing is "Lead Time for Changes", as it implies a metric that tracks each source code commit (e.g. merge request) until it is in production.
- Most organizations will likely consider investing commit tracking in Jira once they see the value of the other metrics, or consider investing in tracking this via their CI/CD pipelines, or via their specific source control package (e.g. git, bitbucket, github, etc.)
- Given this use case long-tails quickly in terms of how organizations track this metric, I deferred this feature until later.
- Days per release vs. Releases per day
- The dashboard I set up is fairly naive about what the actual code is doing. The code normalizes this to a value greater than 1, but the dashboard doesn't flip the meaning of a good vs. bad score. Stated another way, the UX and the data supporting it should be loosely coupled. Not only is this not so, it's closely coupled in a potentially broken way. Fixing this probably looks like allowing a configuration flag for Releases/Day or Days/Release reporting, not having it flip when you cross the threshold.
The following authors have been instrumental in shaping my world-view on software development in general, and software development metrics specifically.
Implementing Lean Software Development by Mary & Tom Poppendieck
Mary & Tom's book articulates many best practices to improve on these metrics, and it introduced me to the idea of the Andon aspect of the Toyota Production System.
Continuous Delivery by Jez Humble and David Farley
Jez and David's book goes into great detail on how to shrink cycle time by adopting Continuous Delivery. It was the authoritative source I used to transform the release processes at a $2B company.
The Phoenix Project by Gene Kim, Kevin Behr, George Spafford
This book puts many of the concepts of cycle time, using dashboards to see flow (like the metrics reported in this package) into an accessible fiction novel. Entertaining and educational in one volume!
Accelerate: The Science of Lean Software and DevOps: Building and Scaling High Performing Technology Organizations by Nicole Forsgren, Jez Humble, Gene Kim
Last and certainly not least, the research behind this book is the closest software development has gotten to research-based (e.g. statistically significant) evidence of factors that influence the productivity and quality of high-performing software teams. The inspiration for reporting of the metrics in this package came to me directly from this book.
In closing, however, while I'm grateful for their influences on my understandings and context, any bugs, quirks, or misunderstandings on how to apply their guidance as evidenced in concept or in code is solely mine.