

![]()


| Inspect patterns across models, heads, prompts, etc. | Inspect a single pattern |
 |
 |
visualization of LLM attention patterns and things computed about them
pattern-lens makes it easy to:
- Generate visualizations of attention patterns, or figures computed from attention patterns, from models supported by TransformerLens
- Compare generated figures across models, layers, and heads in an interactive web interface
pip install pattern-lensThe pipeline is as follows:
- Generate attention patterns using
pattern_lens.activations.acitvations_main(), saving them innpzfiles - Generate visualizations using
pattern_lens.figures.figures_main()-- read thenpzfiles, pass each attention pattern to each visualization function, and save the resulting figures - Serve the web interface using
pattern_lens.server-- web interface reads metadata in json/jsonl files, then lets the user select figures to show
Generate attention patterns and default visualizations:
# generate activations
python -m pattern_lens.activations --model gpt2 --prompts data/pile_1k.jsonl --save-path attn_data
# create visualizations
python -m pattern_lens.figures --model gpt2 --save-path attn_data
serve the web UI:
python -m pattern_lens.server --path attn_datapattern-lens provides two complementary web interfaces for exploring attention patterns:
-
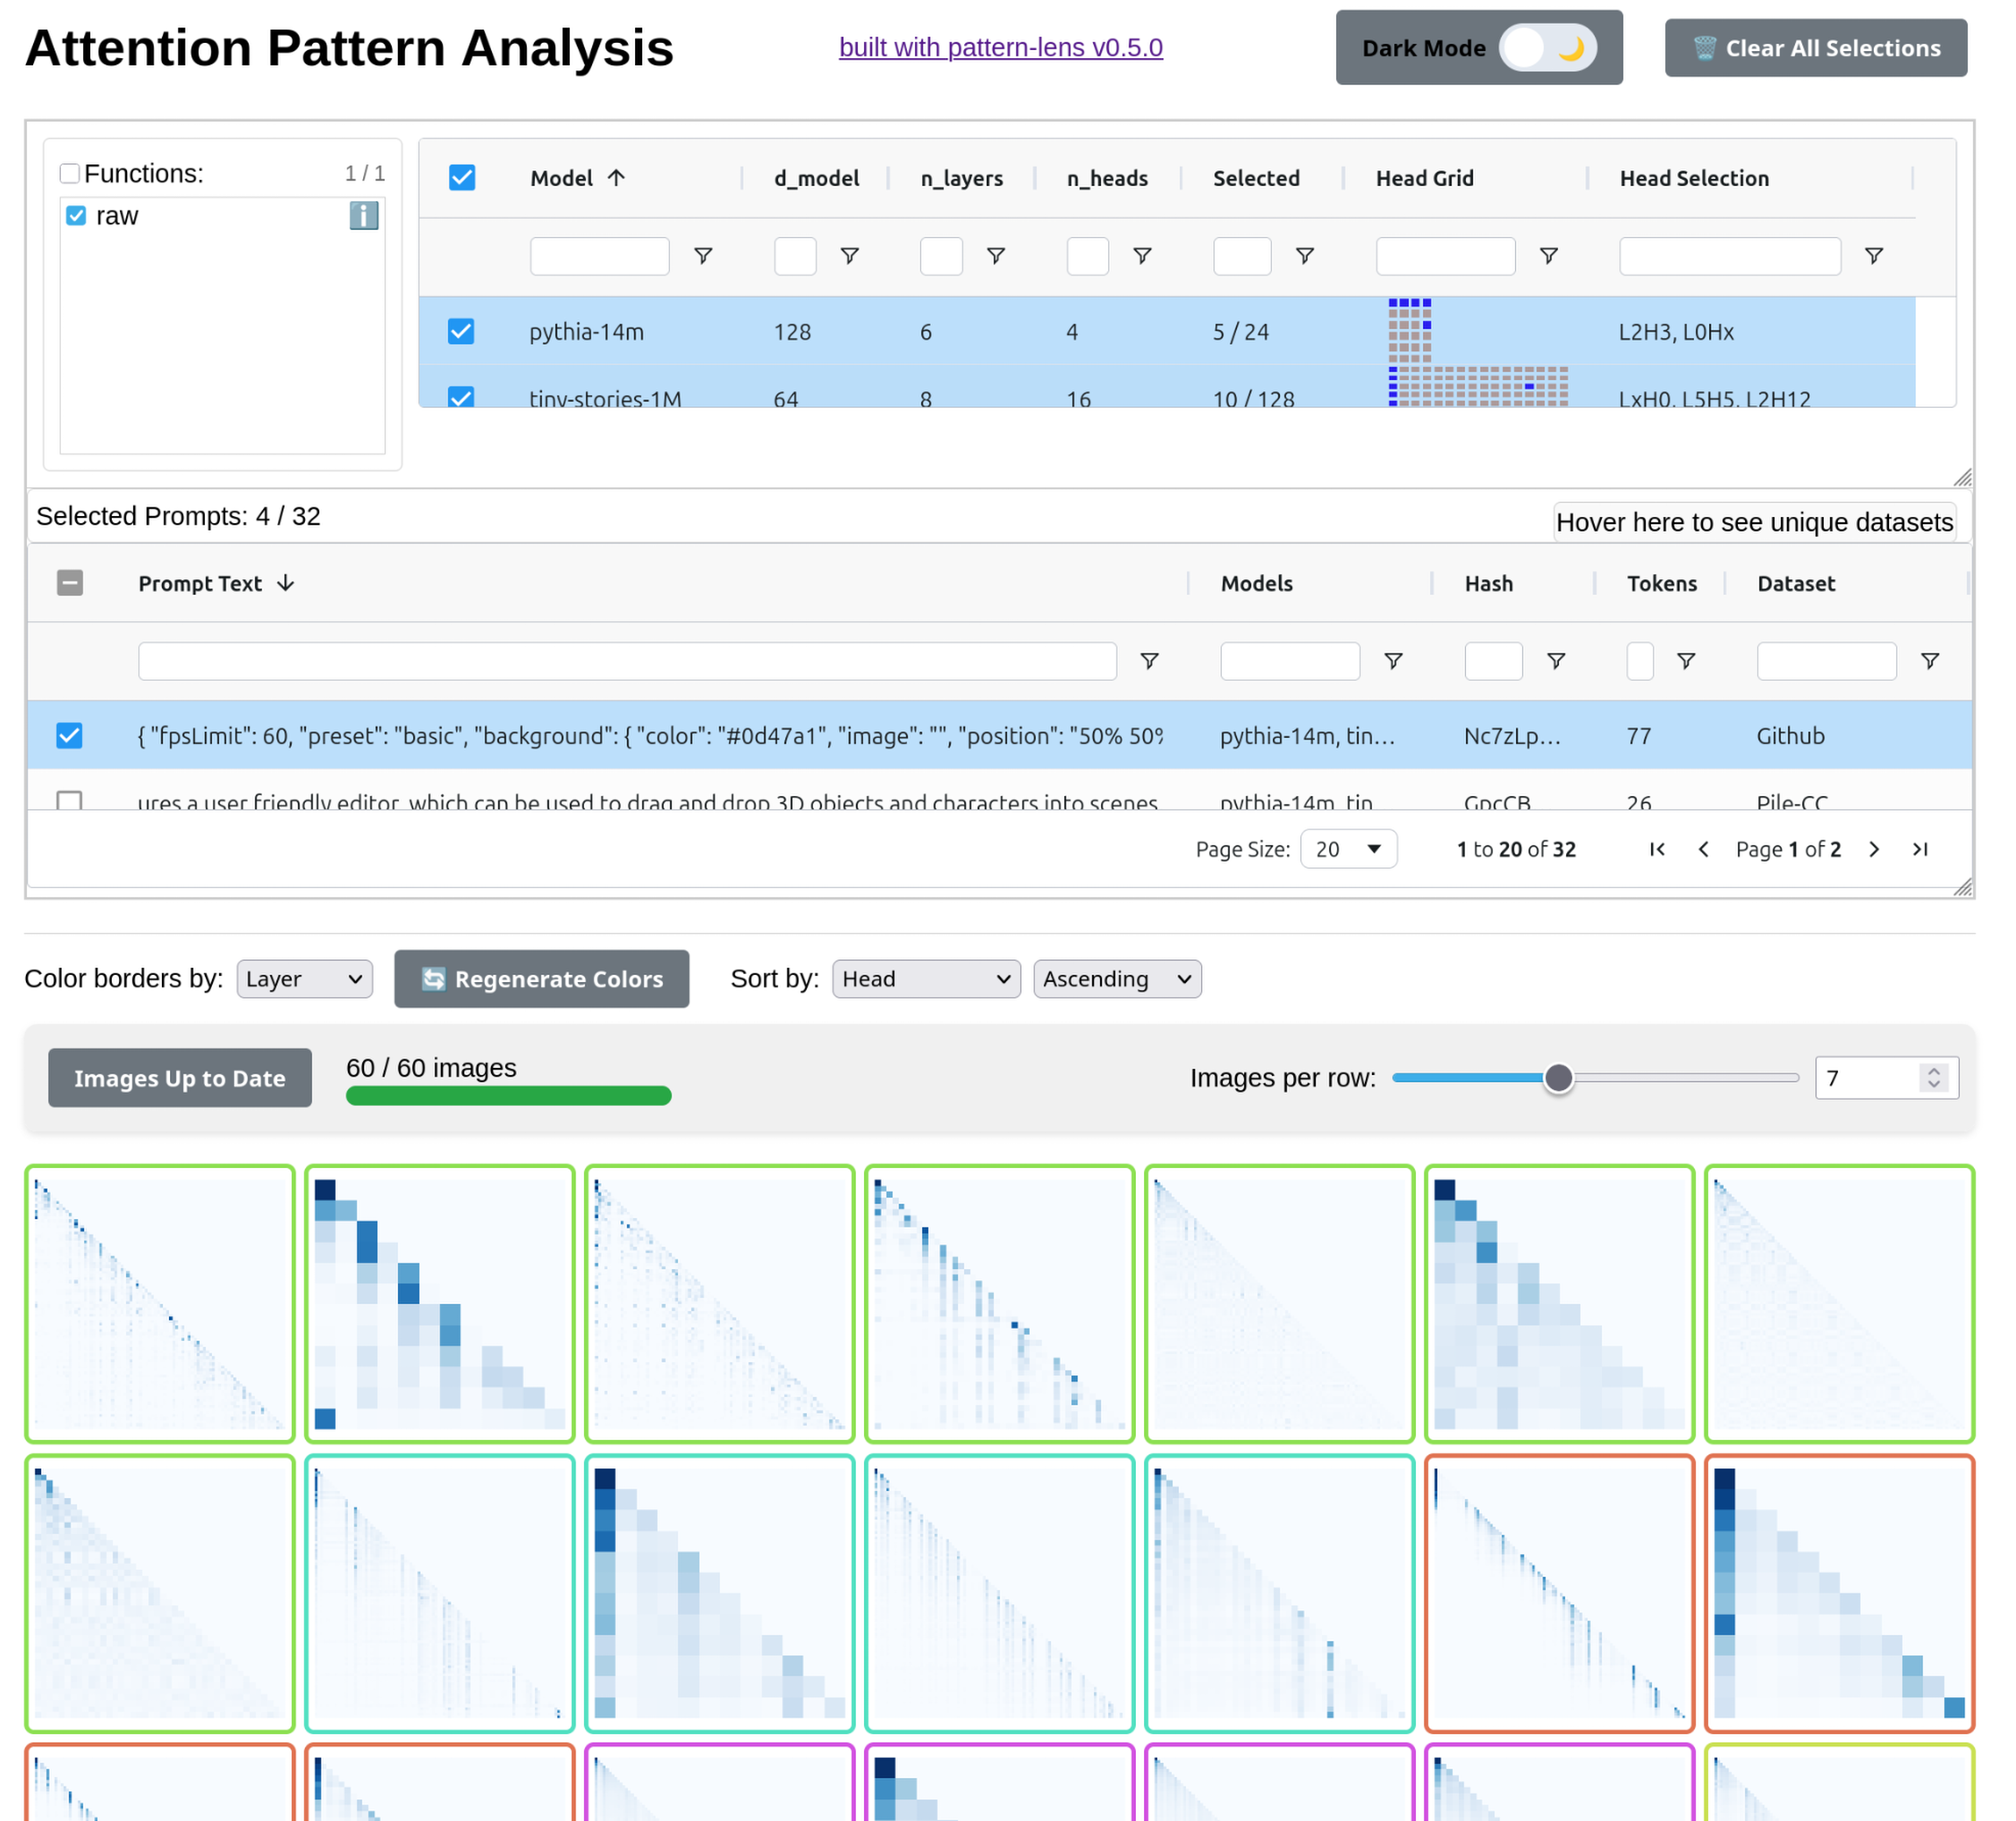
The main interface for comparing attention patterns across models, layers, and heads
- Filter and select patterns by model, layer, head, prompt, etc.
- View multiple patterns simultaneously in a grid layout
- Click patterns to open detailed single-pattern view
-
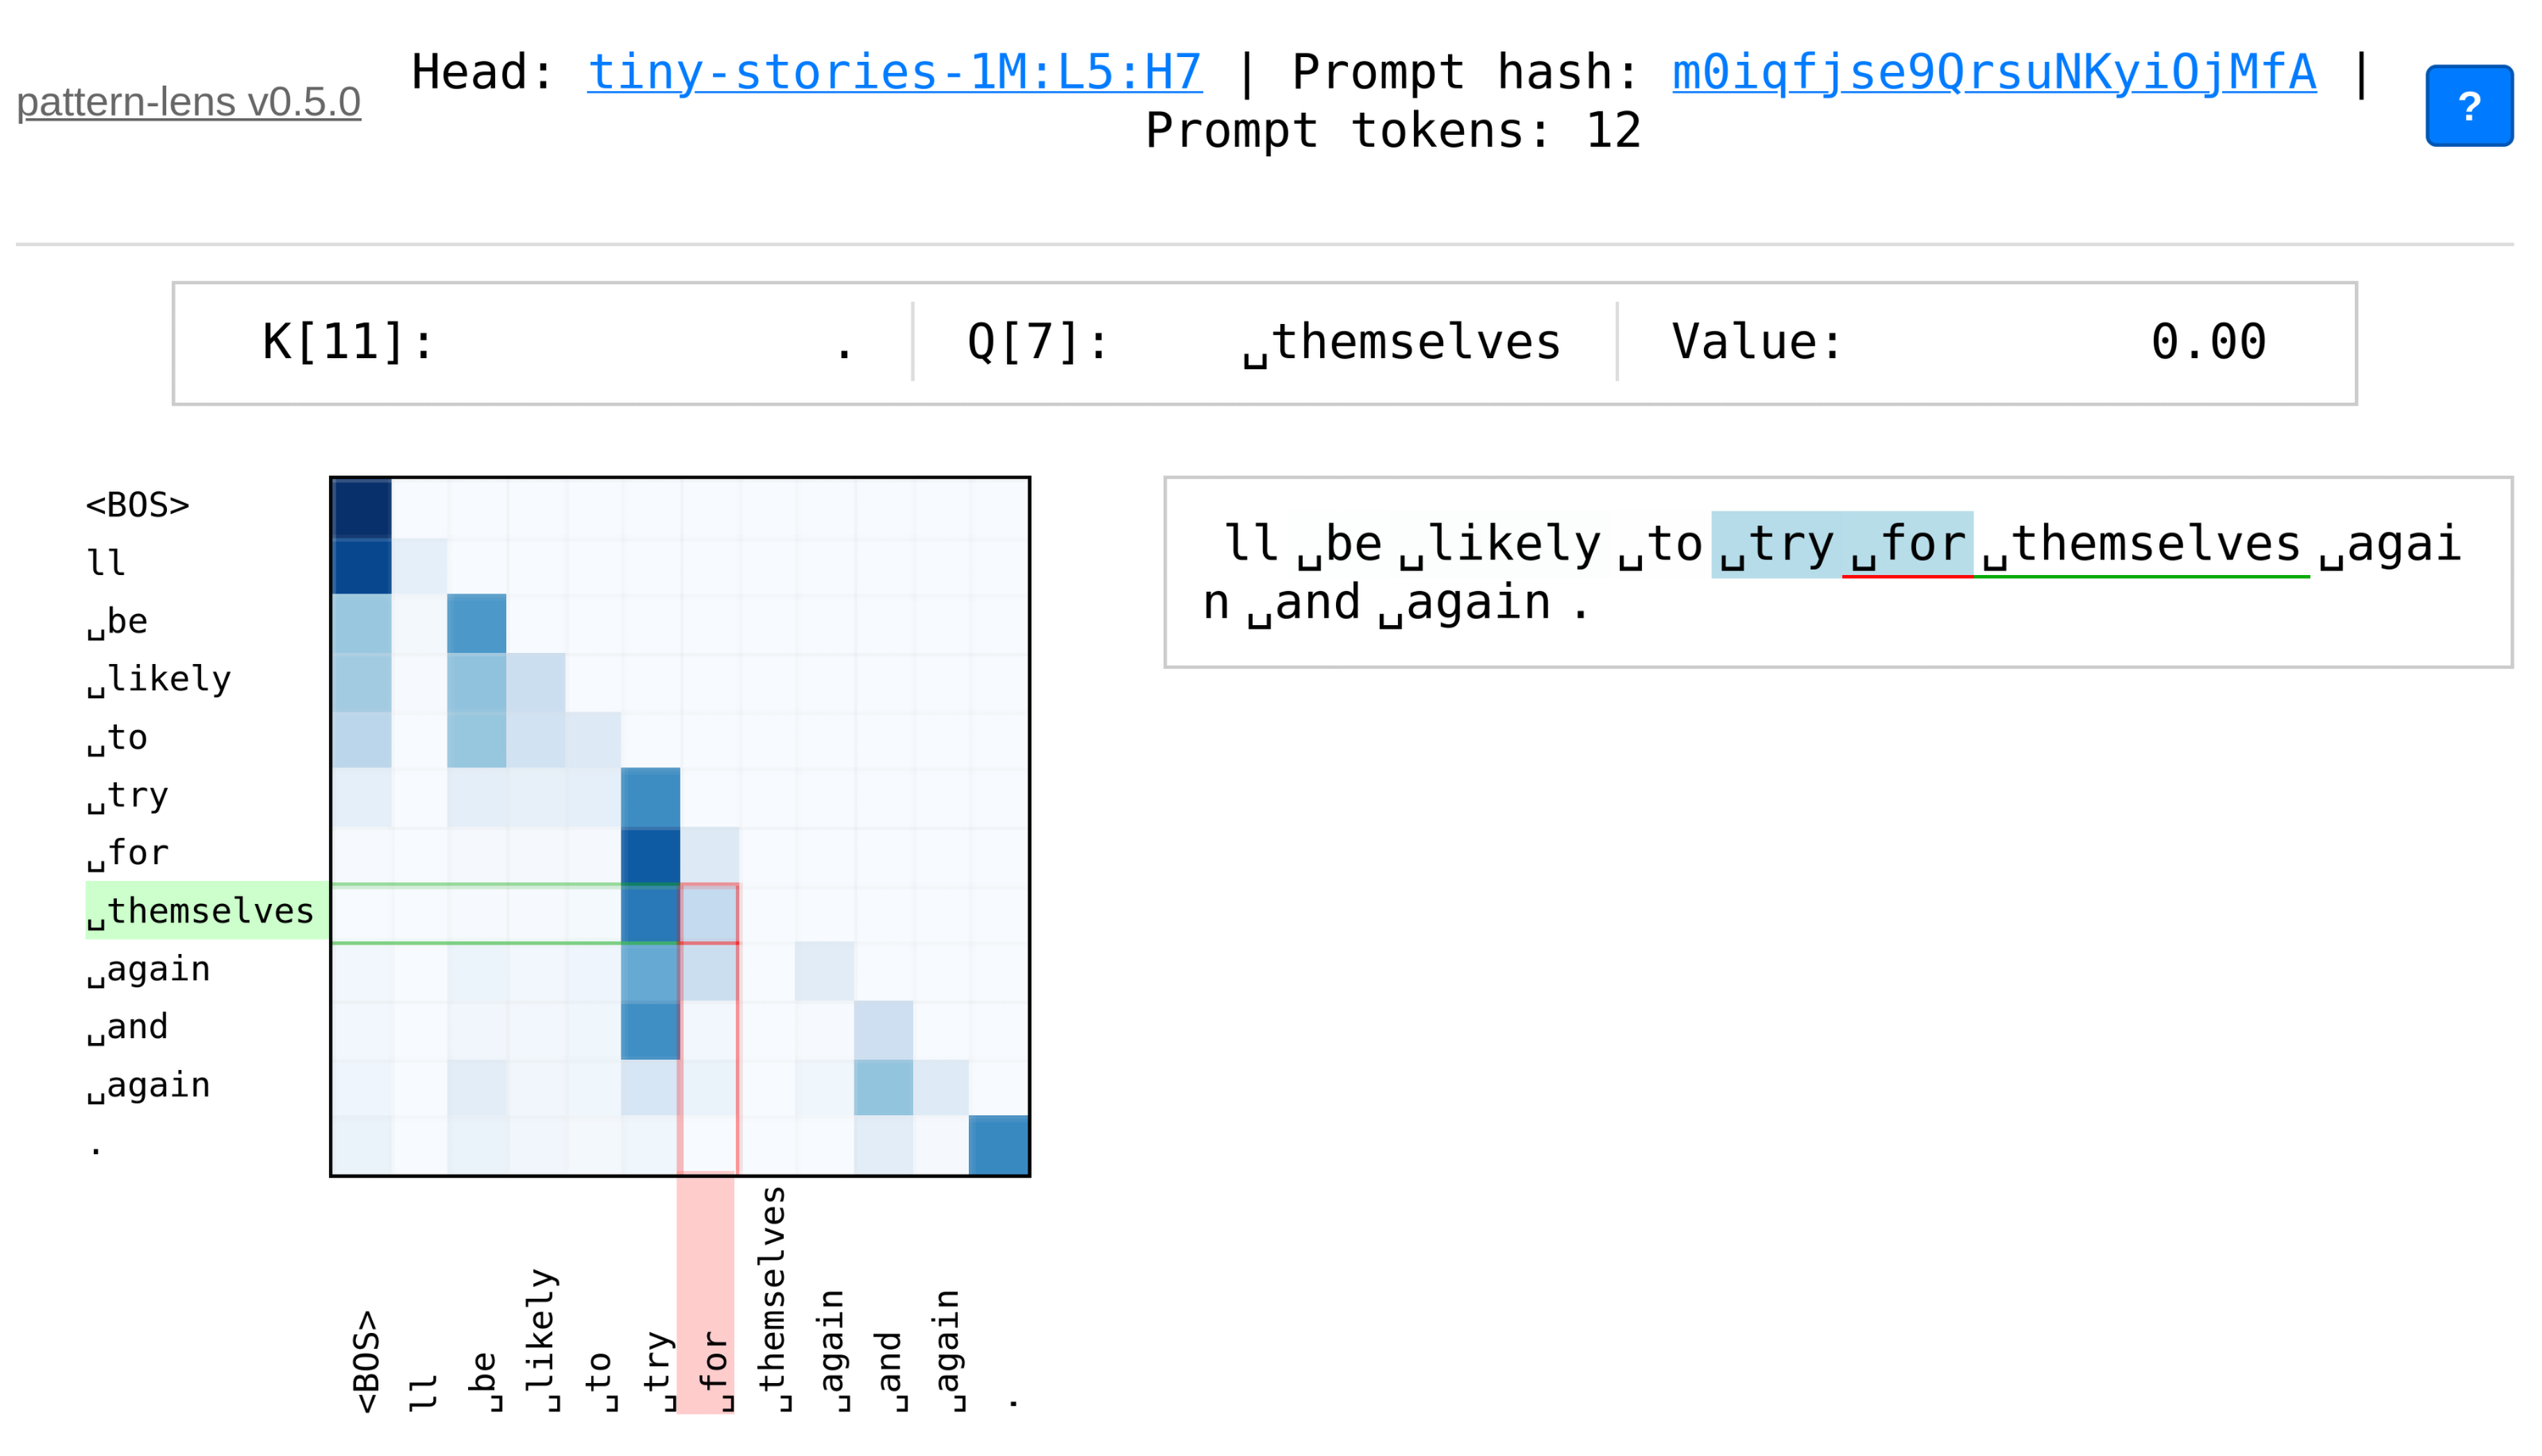
A focused interface for detailed examination of individual attention patterns
- Interactive heatmap with hover highlights and keyboard navigation
- Token-by-token analysis with Q/K axis highlighting
View a demo of the web UI at miv.name/pattern-lens/demo.
Much of this web UI is inspired by CircuitsVis, but with a focus on just attention patterns and figures computed from them. I have also tried to make the interface a bit simpler, more flexible, and faster.
Add custom visualization functions by decorating them with @register_attn_figure_func. You should still generate the activations first:
python -m pattern_lens.activations --model gpt2 --prompts data/pile_1k.jsonl --save-path attn_data
and then write+run a script/notebook that looks something like this:
import numpy as np
import matplotlib.pyplot as plt
from scipy.linalg import svd

# these functions simplify writing a function which saves a figure
from pattern_lens.figure_util import matplotlib_figure_saver, save_matrix_wrapper
# decorator to register your function, such that it will be run by `figures_main`
from pattern_lens.attn_figure_funcs import register_attn_figure_func
# runs the actual figure generation pipeline
from pattern_lens.figures import figures_main

# define your own functions
# this one uses `matplotlib_figure_saver` -- define a function that takes matrix and `plt.Axes`, modify the axes
@register_attn_figure_func
@matplotlib_figure_saver(fmt="svgz")
def svd_spectra(attn_matrix: np.ndarray, ax: plt.Axes) -> None:
    # Perform SVD
    U, s, Vh = svd(attn_matrix)

    # Plot singular values
    ax.plot(s, "o-")
    ax.set_yscale("log")
    ax.set_xlabel("Singular Value Index")
    ax.set_ylabel("Singular Value")
    ax.set_title("Singular Value Spectrum of Attention Matrix")


# run the figures pipelne
# run the pipeline
figures_main(
	model_name="pythia-14m",
	save_path=Path("docs/demo/"),
	n_samples=5,
	force=False,
)
See demo.ipynb for a full example.