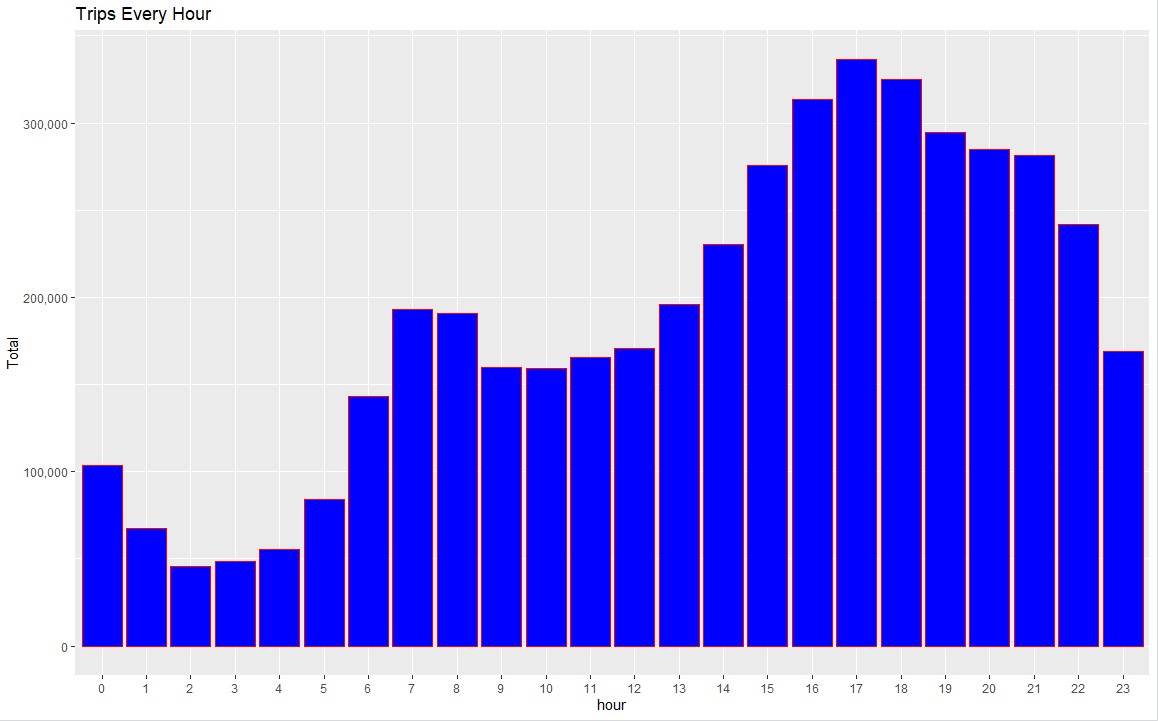
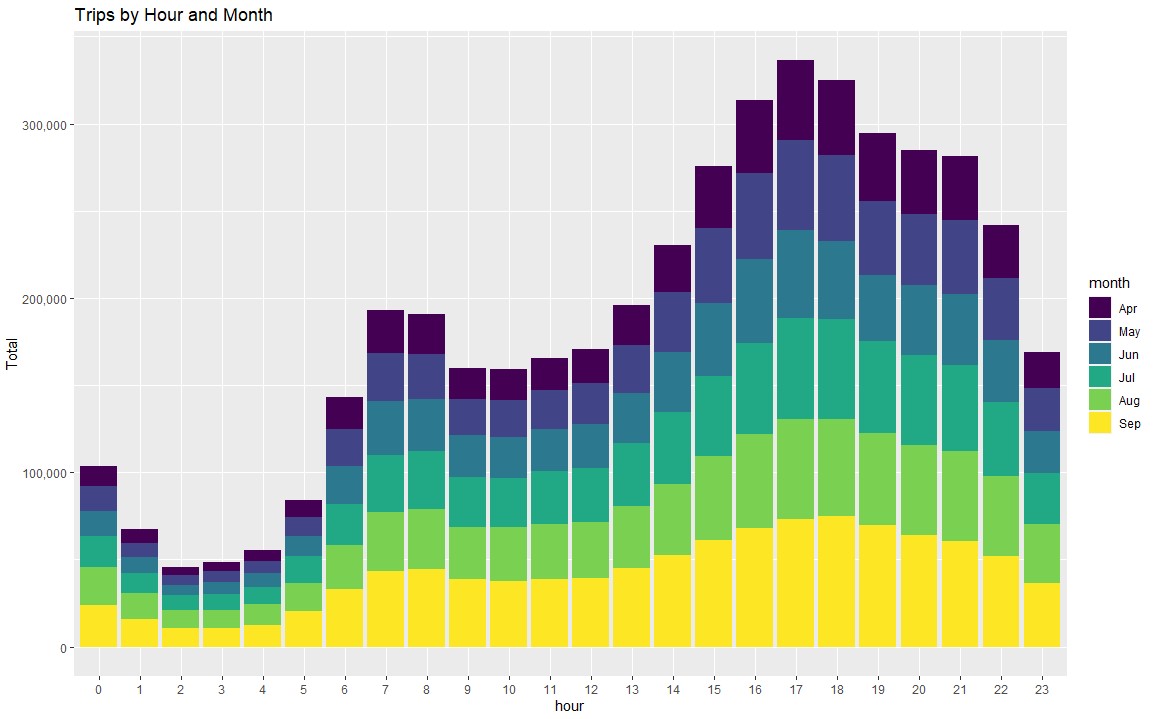
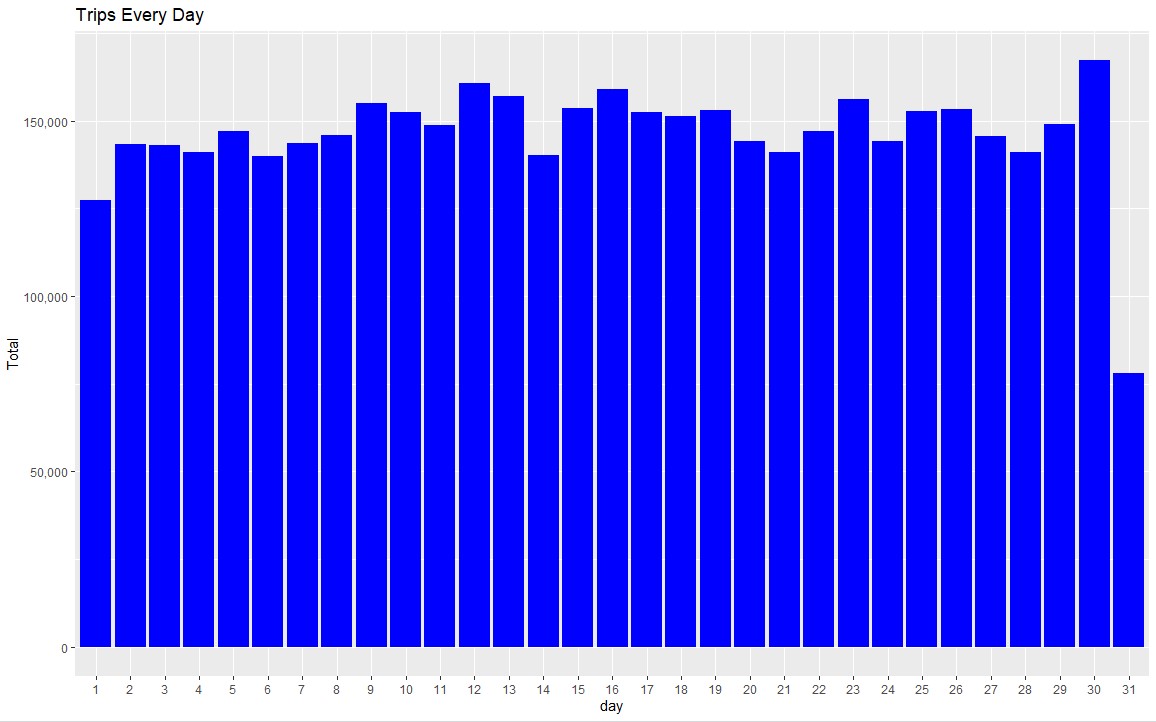
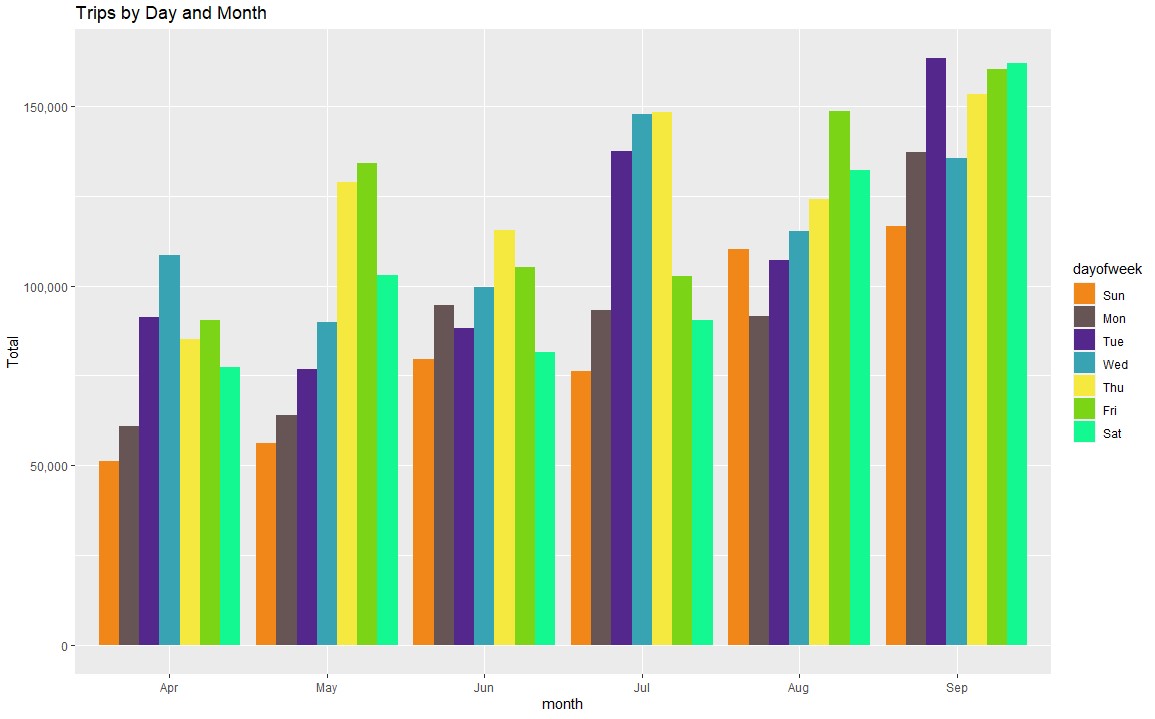
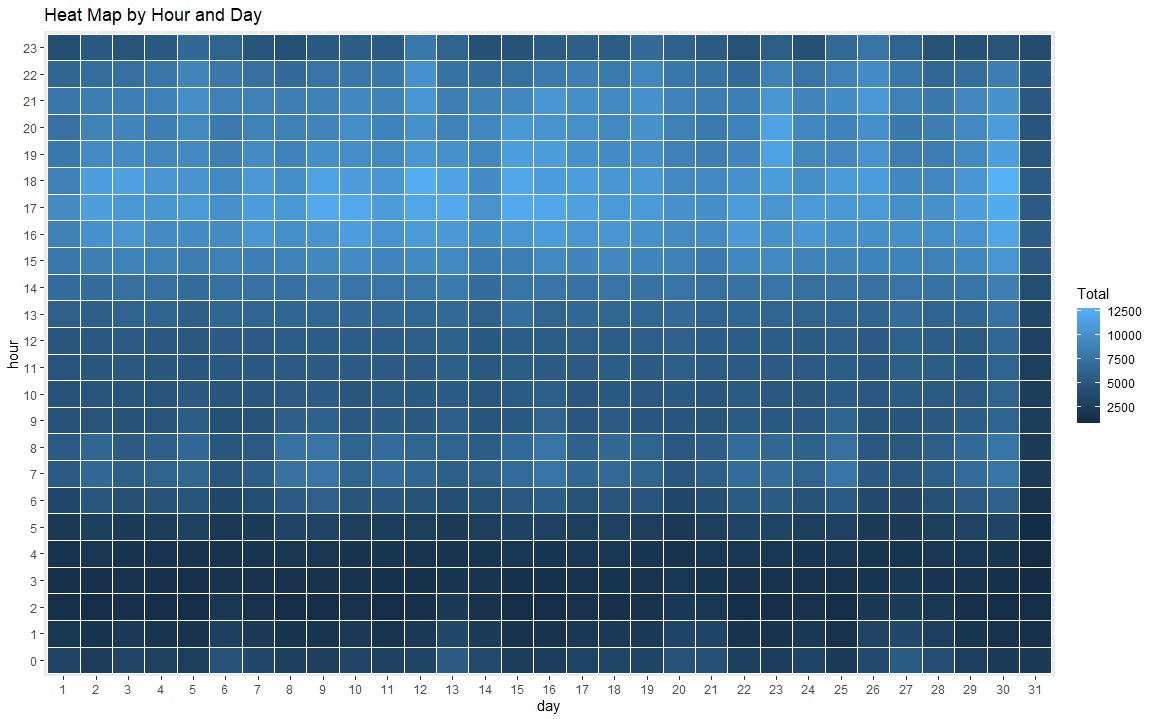
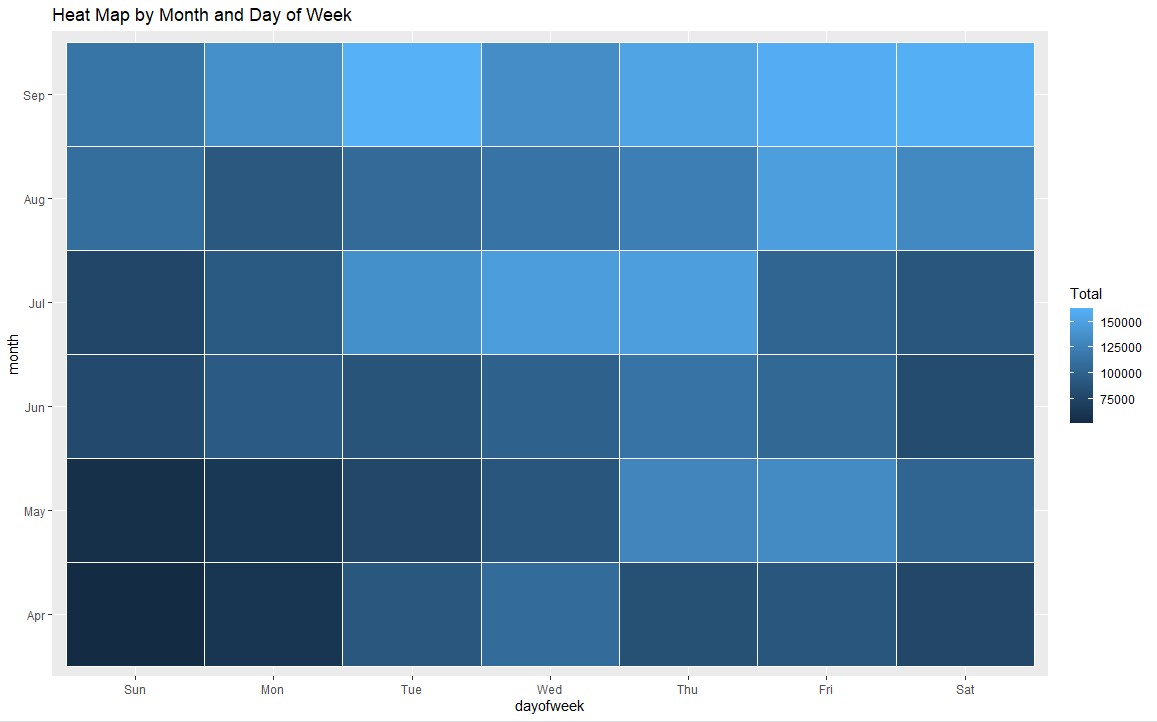
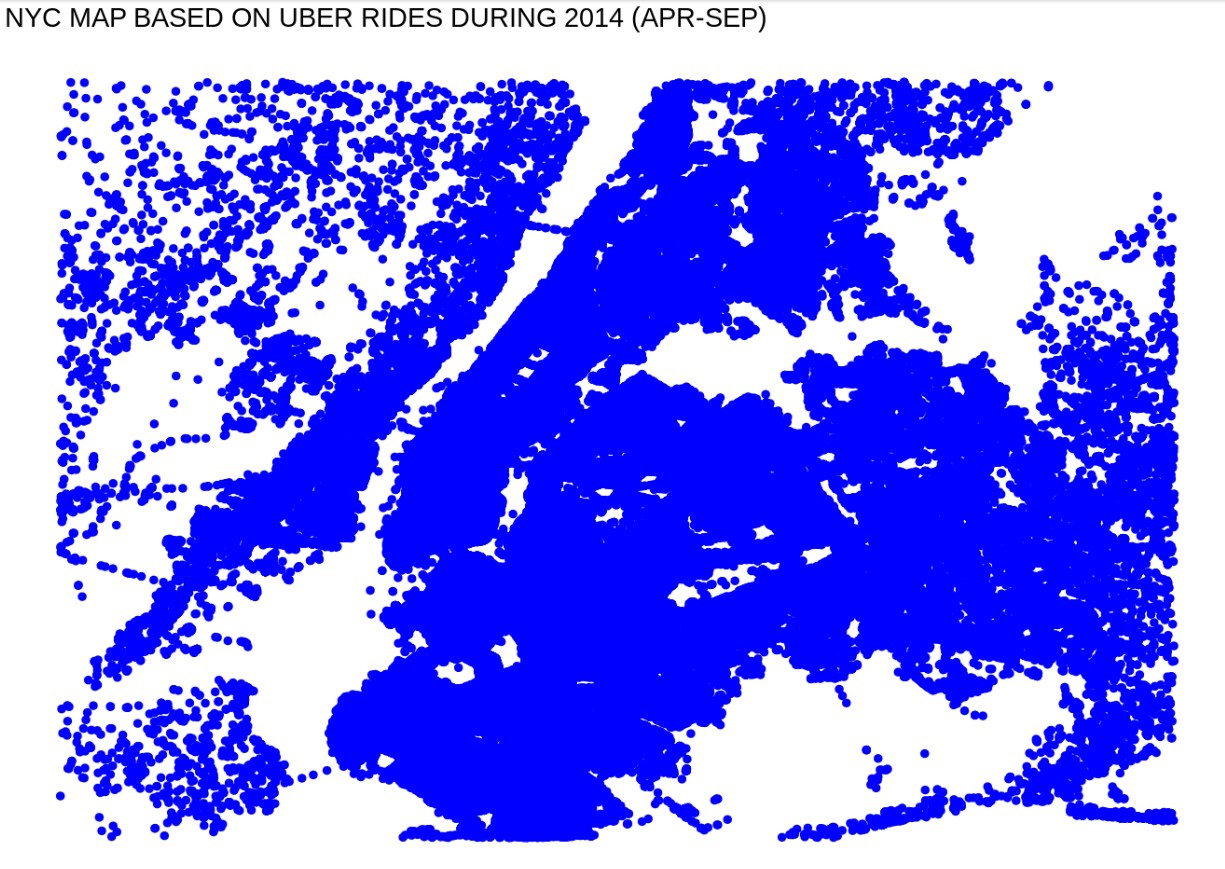
Data storytelling is an important component of machine learning which companies can utilize to understand the background of their operations. Hence, this project uses R to manipulate and aggregate the New York City Uber Ride Pickup dataset in order to generate simple and complex graphs that can be used to discover patterns and trends.
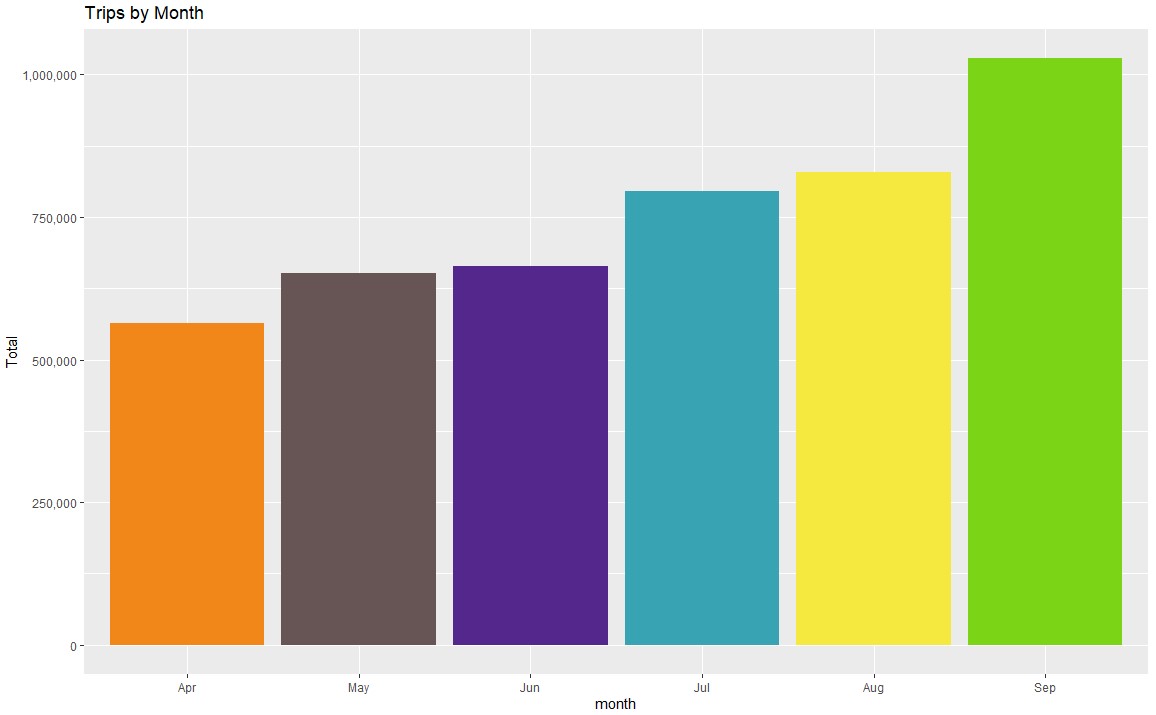
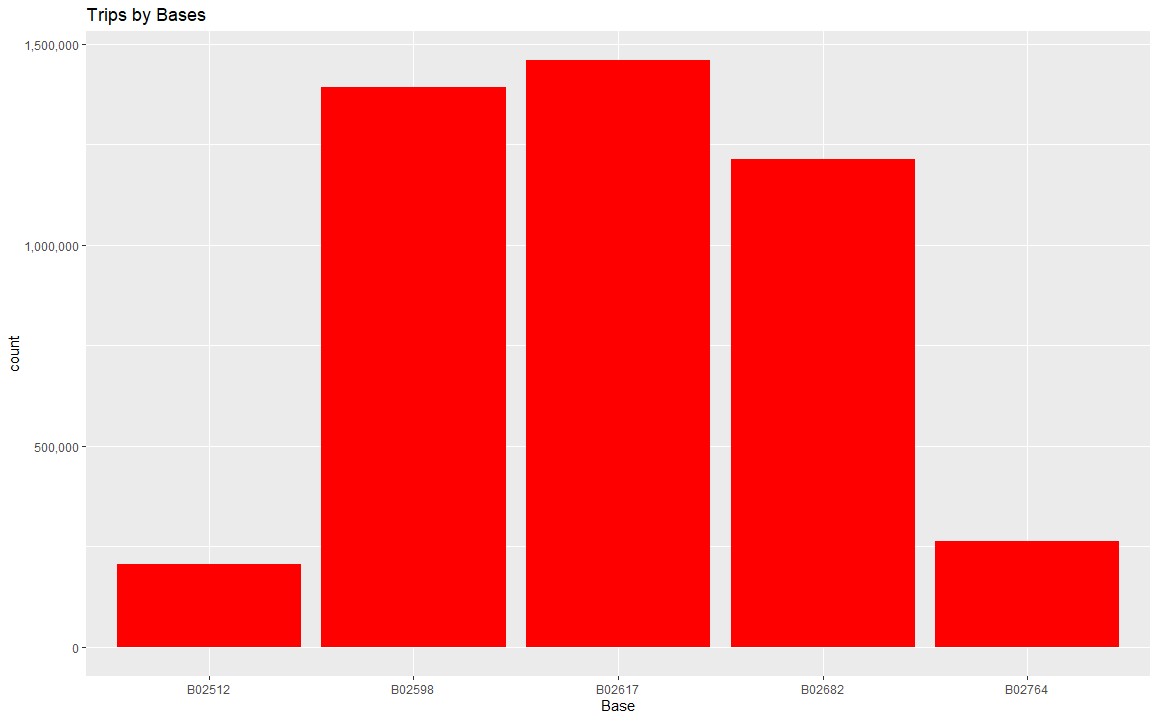
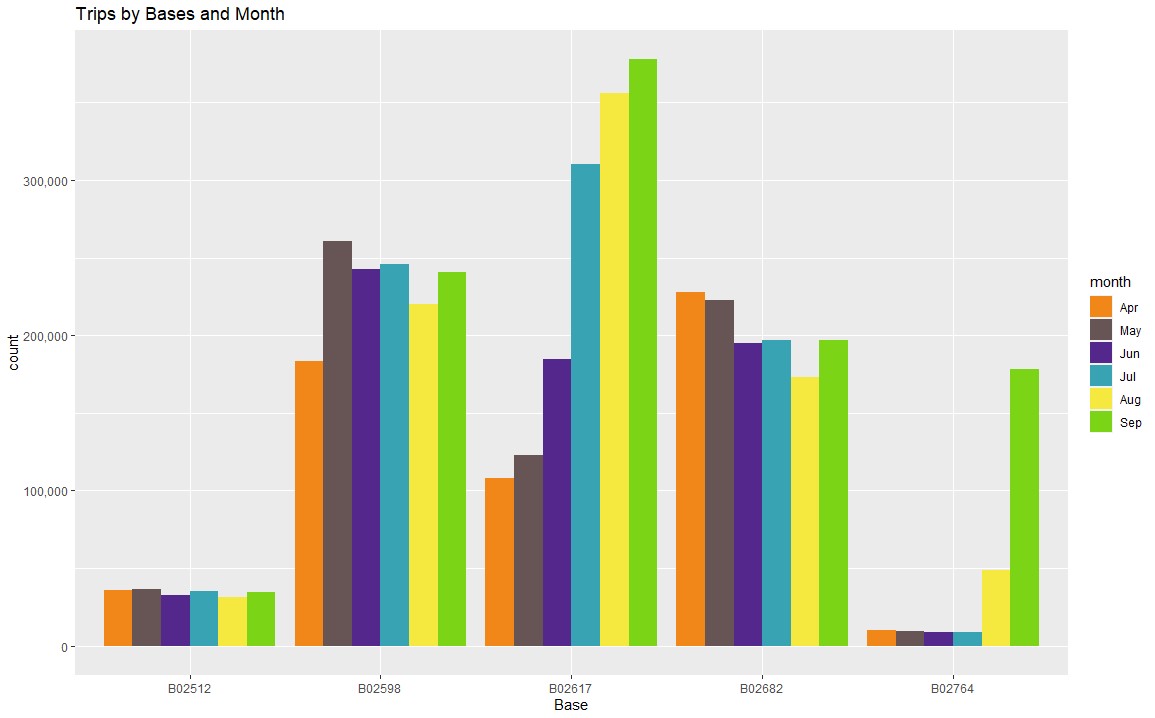
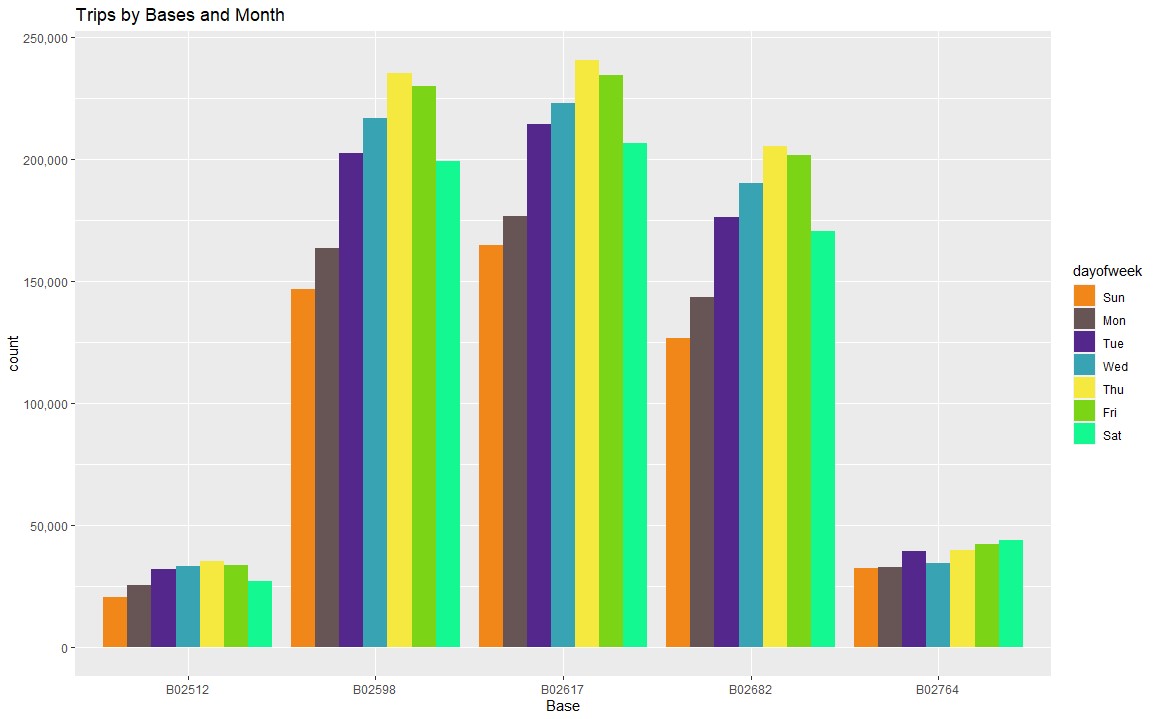
You can find the data visualizations I created below:
Note: The comments in the R Script match with the graph titles