A simple CLI tool to ping DNS servers and plot their query times directly in your terminal. Inspired by gping.
This tool lets you quickly compare the performance of multiple DNS servers in a visual and easy-to-understand way, without leaving your command line.
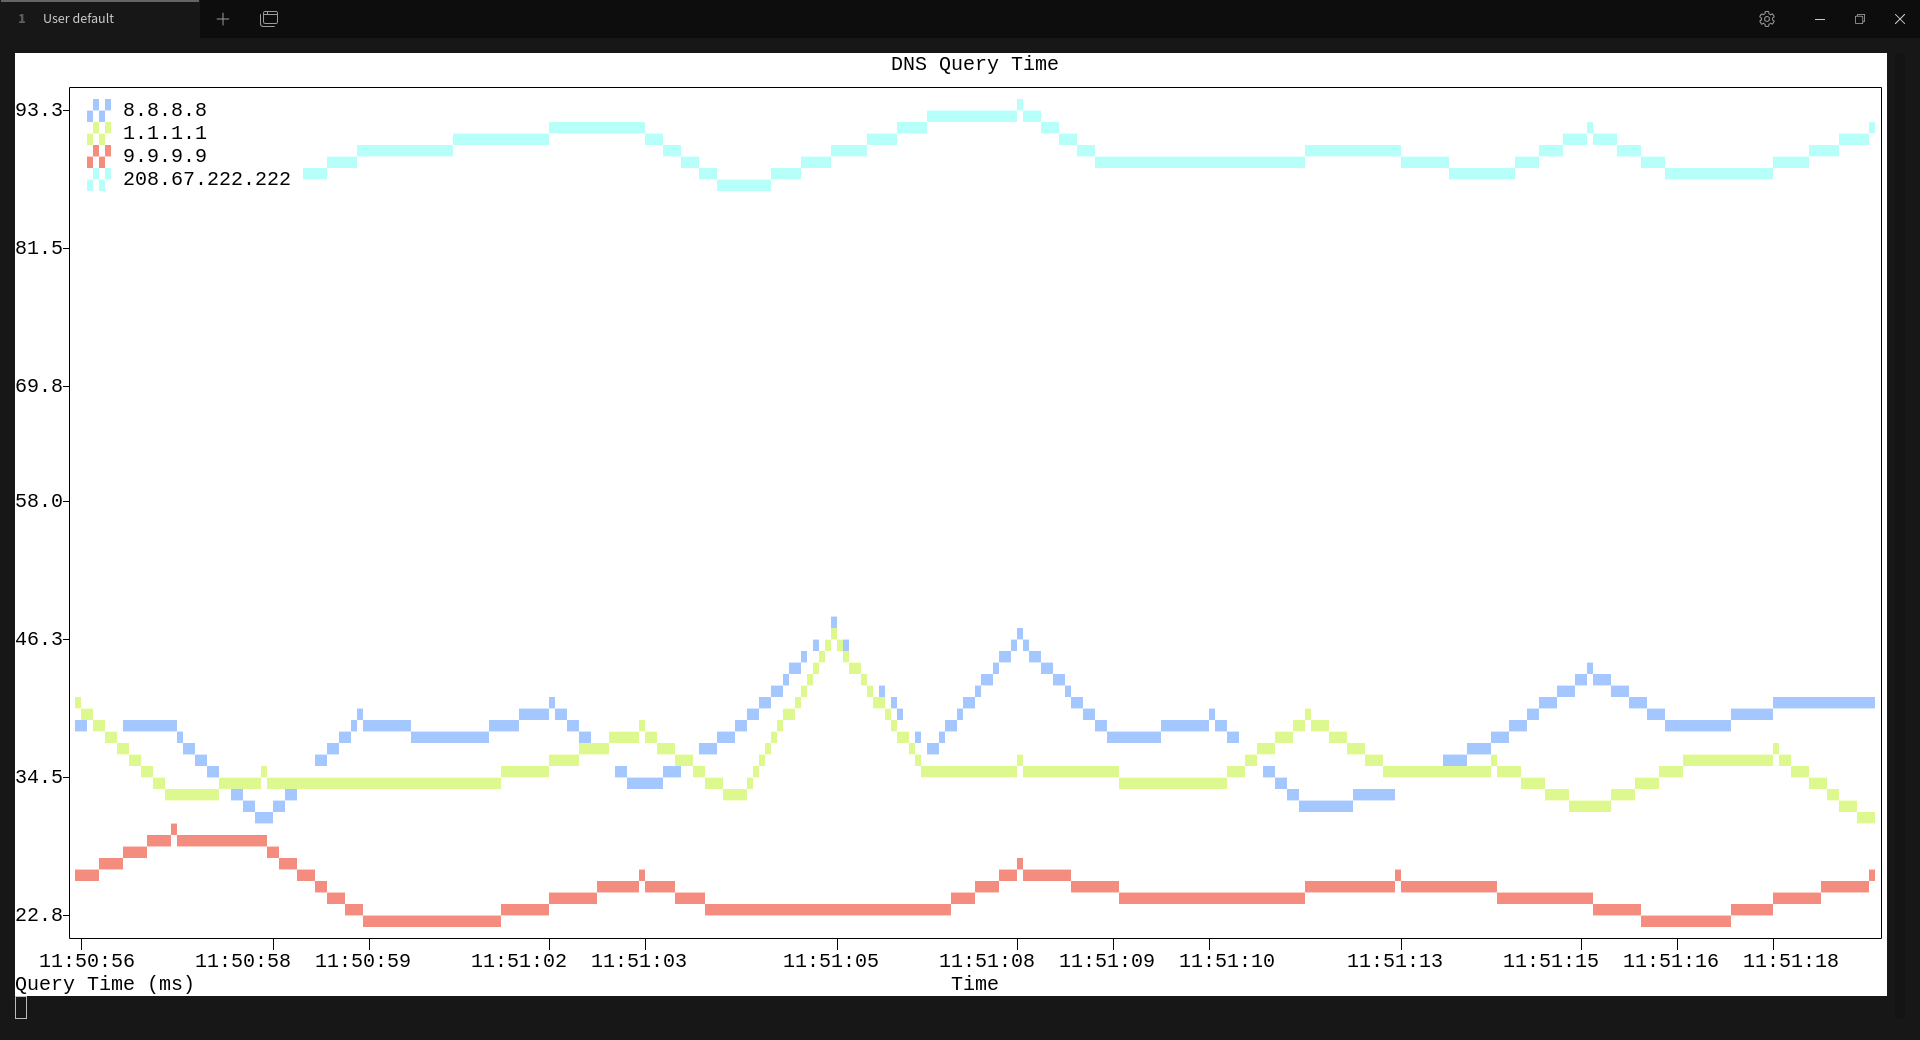
(This is a sample of gdns in action!)
- Real-time Plotting: Visualizes DNS query times in a live graph in your terminal.
- Multiple Servers: Compare any number of DNS servers simultaneously.
- Customizable: Test resolution against a specific domain using the
--domainflag. - Lightweight: Built with Python,
dnspython, and the awesomeplotextfor terminal graphing.
To get started, clone the repository and set up the Python virtual environment.
# 1. Clone the repository
git clone https://github.com/overdigo/gdns.git

# 2. Navigate to the project directory
cd gdns

# 3. Create and activate a Python virtual environment
python3 -m venv venv
source venv/bin/activate

# 4. Install the required dependencies
pip install -r requirements.txtTo run the tool, call the script with the Python interpreter from the virtual environment, followed by the IP addresses of the DNS servers you want to test.
Basic Example:
./venv/bin/python gdns.py 8.8.8.8 1.1.1.1Testing a specific domain:
By default, gdns queries google.com. You can specify a different domain:
./venv/bin/python gdns.py 8.8.8.8 1.1.1.1 --domain wikipedia.orgPro-Tip: Create an Alias
For easier access, you can add an alias to your shell's configuration file (~/.bashrc, ~/.zshrc, etc.).
alias gdns='/path/to/your/gdns/venv/bin/python /path/to/your/gdns/gdns.py'After adding the alias and reloading your shell, you can simply run:
gdns 8.8.8.8 1.1.1.1
This project is licensed under the MIT License.