A program made with Python that transforms any spectrum of sound signal to visual representation of the sound frequencies.
The program uses Fast Fourier Transformation, which essentially decomposes a signal into a set of sinusoidal components of different frequencies.
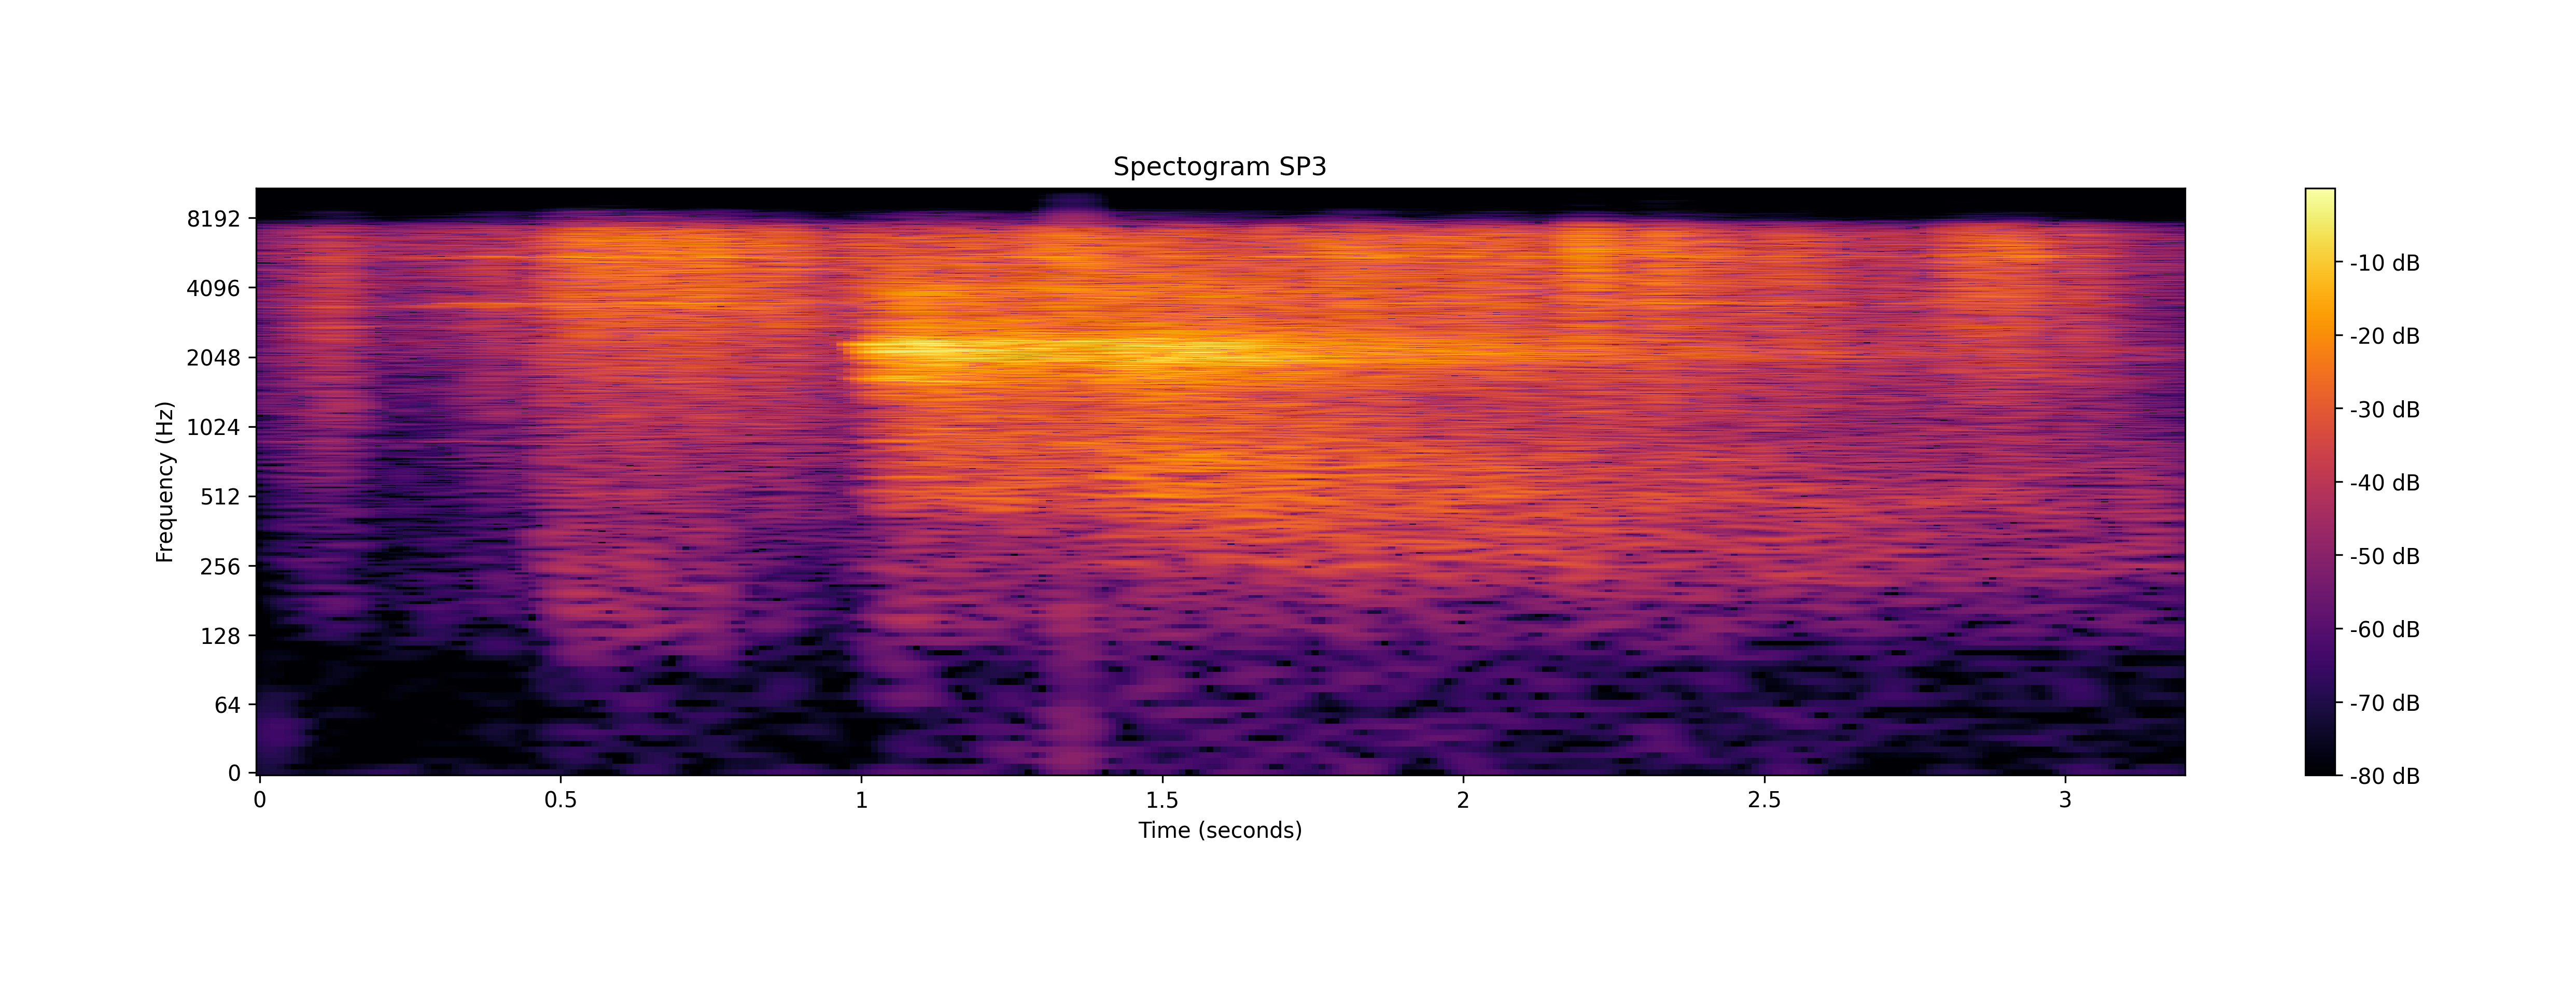
Once the signal has been decomposed into its individual frequency components, the spectrogram then displays this information as a 2D image, with time on the x-axis, frequency on the y-axis, and the intensity of each frequency component represented by the color or brightness of the corresponding pixel.
Clone the repository with git clone https://github.com/rezw4n/Spectrogram.git
Move to the cloned repository cd Spectrogram
Install the required packages with pip install -r requirements.txt
Run the Jupyter Lab by opening bash/terminal/powershell, type jupyter lab and hit enter.
Play around with the notebook!