


![]()

laserbeamsize is a Python library for fast and reliable calculation of laser beam sizes from images.
It implements the ISO 11146 variance method with enhancements that reduce sensitivity to background offset, noise, and nonideal beam profiles.
The package also provides automated tools for estimating M² from beam diameter measurements taken at multiple propagation distances.
Extensive documentation is available at:
https://laserbeamsize.readthedocs.io
- Robust beam size extraction using the ISO 11146 variance method
- Automatic estimation of centroid, major/minor axes, and rotation
- Works with Gaussian, astigmatic, and strongly non-Gaussian beams (TEM modes)
- Handles 8-, 12-, and 16-bit grayscale images
- One-function visual reporting tools
- Convenient functions for M² fitting and plotting
- Minimal dependencies
Install using pip:
pip install laserbeamsize
Or with conda:
conda install -c conda-forge laserbeamsize
You can also run the library immediately in the browser using JupyterLite:
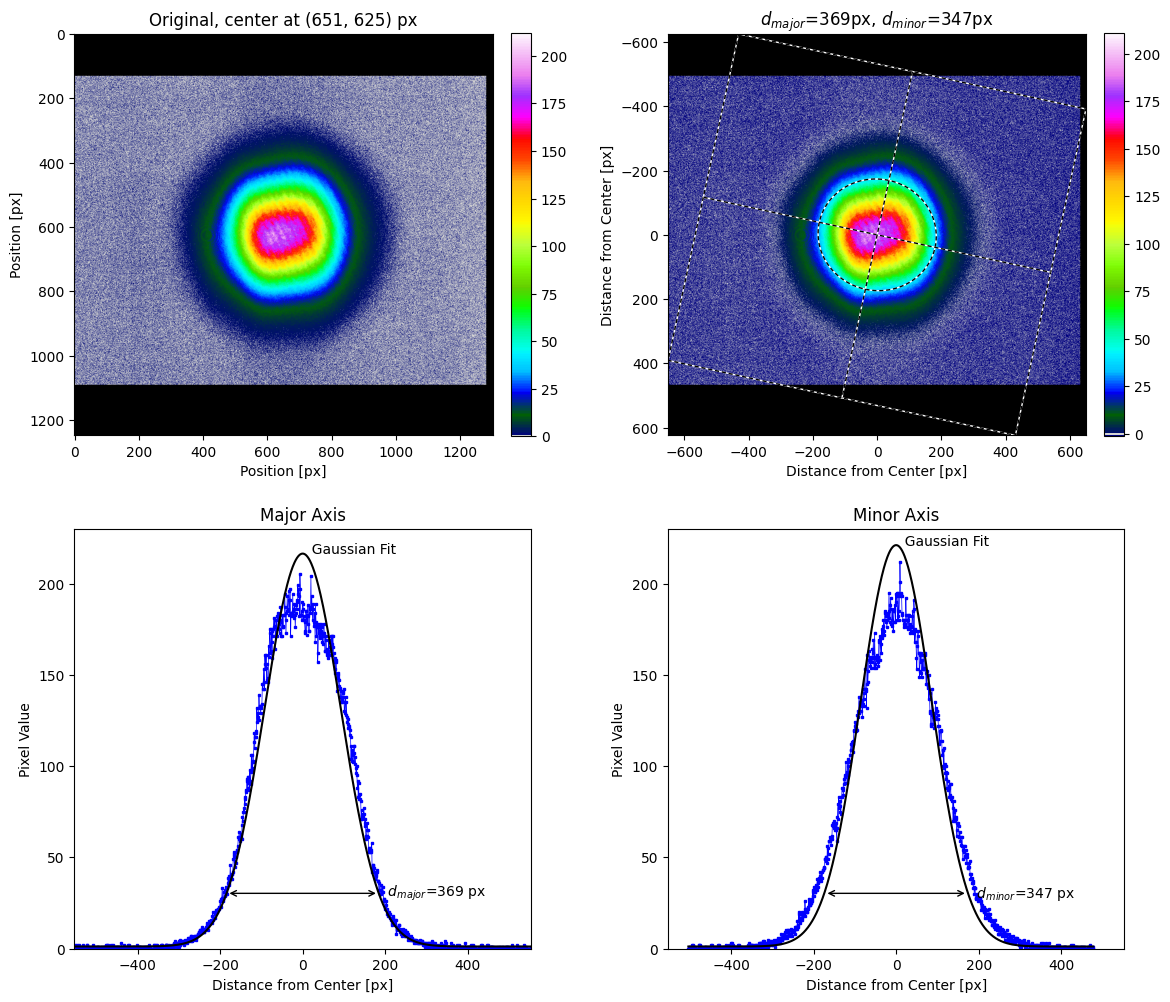
Example showing how to compute beam center, major/minor axes, and rotation.
import imageio.v3 as iio
import laserbeamsize as lbs

file = "https://github.com/scottprahl/laserbeamsize/raw/main/docs/images/t-hene.pgm"
beam = iio.imread(file)

x, y, d_major, d_minor, phi = lbs.beam_size(beam)

print(f"Beam center: ({x:.0f}, {y:.0f})")
print(f"Major axis:  {d_major:.0f} pixels")
print(f"Minor axis:  {d_minor:.0f} pixels")
print(f"Rotation:    {phi * 180/3.1416:.0f}° CCW")
results in:
Beam center: (651, 492)
Major axis:  369 pixels
Minor axis:  347 pixels
Rotation:    -12° CCW
To produce an annotated visual report.
lbs.plot_image_analysis(beam)
plt.show()
Resulting example:
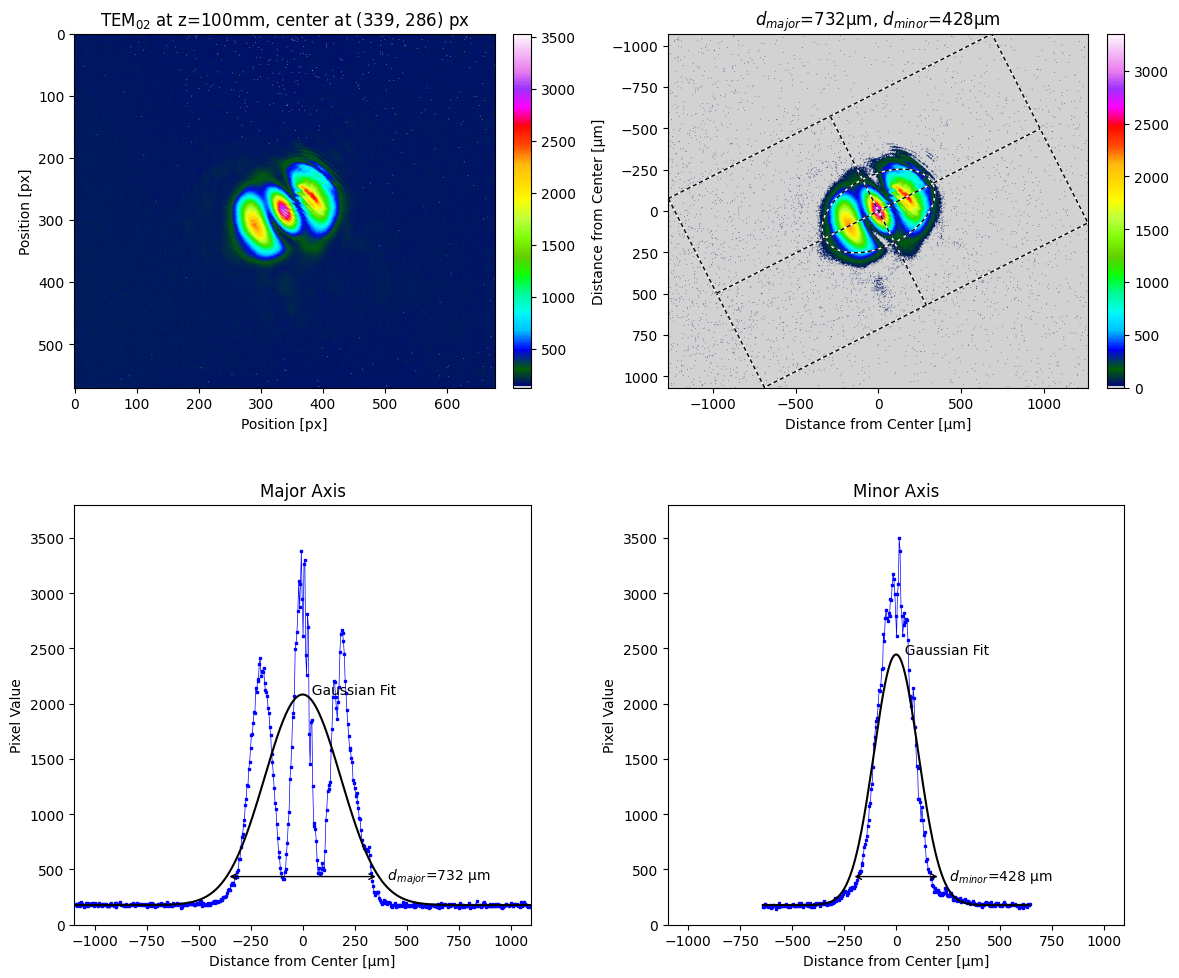
The analysis also works for beams that are not well approximated by a Gaussian. For example, a TEM02 mode.
tem02 = imageio.imread("TEM02_100mm.pgm") >> 4  # 12-bit data stored in 16-bit container
lbs.plot_image_analysis(tem02, title="TEM$_{02}$ at z=100 mm", pixel_size=3.75)
plt.show()
Example output:
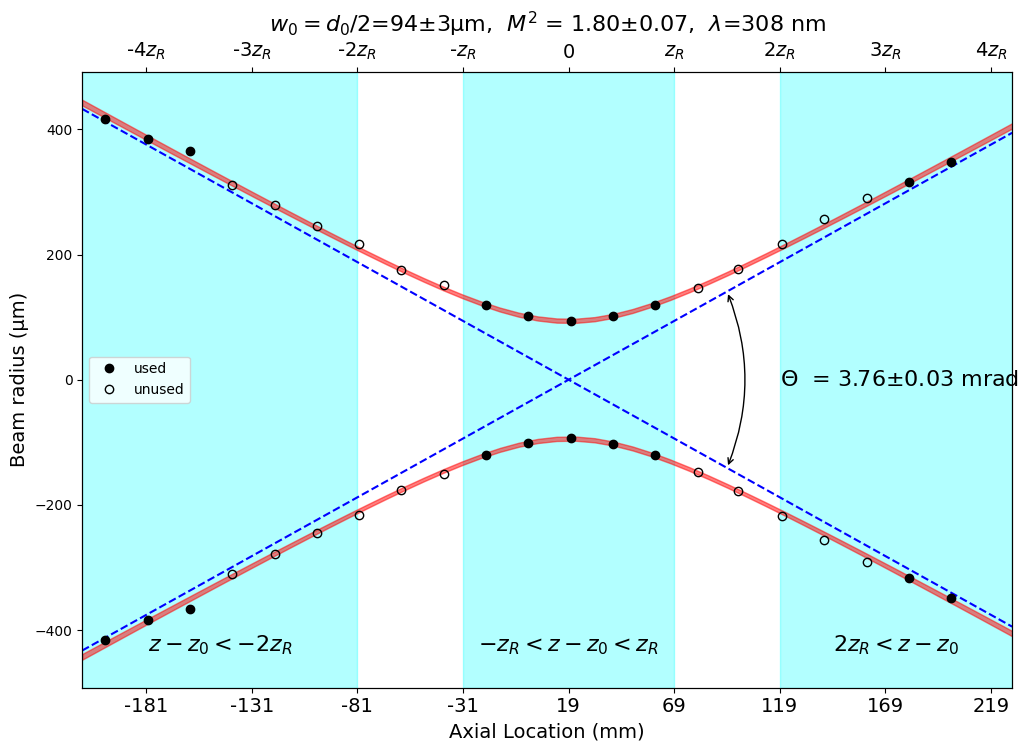
Estimating M² requires beam diameters at several locations along the propagation axis. The beam diameters should be measured within ±1 Rayleigh distance and more than ±2+ Rayleigh distances.
lambda1 = 308e-9  # meters
z1 = np.array([-200,-180,-160,-140,-120,-100,-80,-60,-40,-20,0,20,40,60,80,99,120,140,160,180,200]) * 1e-3
d1 = 2*np.array([416,384,366,311,279,245,216,176,151,120,101,93,102,120,147,177,217,256,291,316,348]) * 1e-6

lbs.M2_radius_plot(z1, d1, lambda1, strict=True)
plt.show()
Example fit:
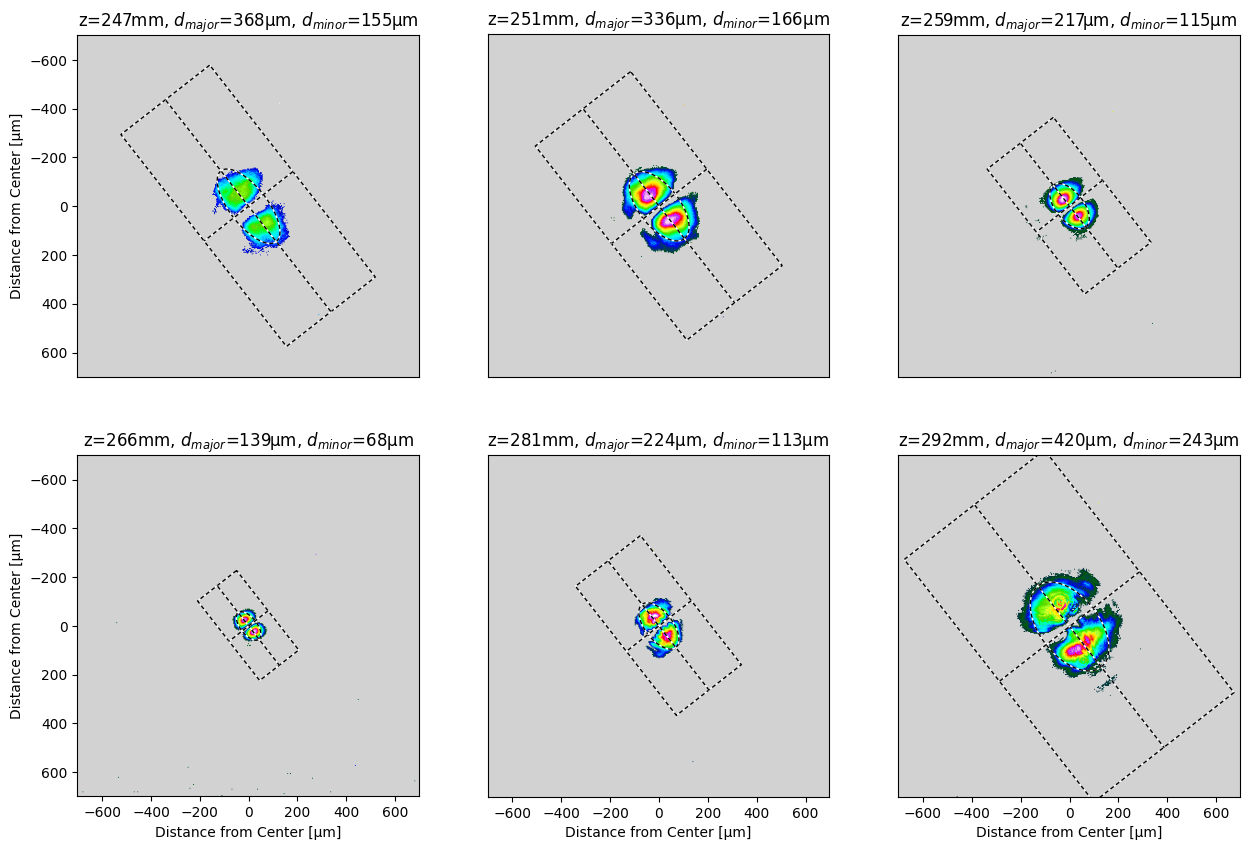
The following analysis uses images collected at non-ideal distances but illustrates the fitting process. The beam is a HeNe laser operating predominantly in the TEM01 mode and rotated -52°
lambda0 = 632.8e-9  # meters
z = np.array([247, 251, 259, 266, 281, 292]) * 1e-3  # meters
filenames = [repo + "sb_%.0fmm_10.pgm" % (number * 1e3) for number in z]

# the 12-bit pixel images are stored in high-order bits in 16-bit values
tem10 = [iio.imread(name) >> 4 for name in filenames]

# remove top to eliminate artifact
for i in range(len(z)):
    tem10[i] = tem10[i][200:, :]

# find beam in all the images rotated -52° and create arrays of beam diameters
options = {
    "pixel_size": 3.75,
    "units": "µm",
    "crop": [1400, 1400],
    "z": z,
    "phi_fixed": np.radians(-52),
    "iso_noise": False
}

d_minor, d_major = lbs.plot_image_montage(tem10, **options)
plt.show()
Example montage output:
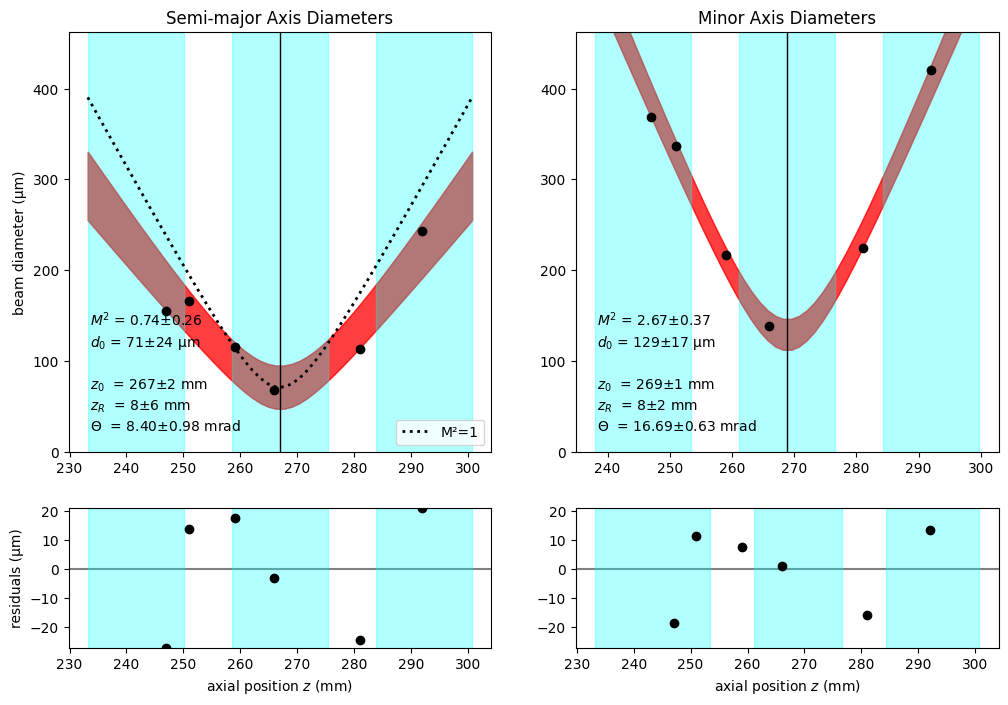
Using the measured diameters:
lbs.M2_diameter_plot(z10, dx*1e-6, lambda0, dy=dy*1e-6)
plt.show()
In the example, the dashed curve indicates the ideal divergence of a Gaussian beam. The fitted M² of approximately 2.6 ± 0.7 agrees with the expected value of 3 for a TEM10 mode, though the undersampling results in underestimated divergence.
If you use laserbeamsize in academic, instructional, or applied technical work, please cite:
Prahl, S. (2025). laserbeamsize: ISO 11146 Calculation of Laser Beam Center, Diameter, and M² (Version 2.3.0) [Computer software]. Zenodo. https://doi.org/10.5281/zenodo.8346799
@software{laserbeamsize_prahl_2025,
  author    = {Scott Prahl},
  title     = {laserbeamsize: ISO 11146 Calculation of Laser Beam Center, Diameter, and M²},
  year      = {2025},
  version   = {2.3.0},
  doi       = {10.5281/zenodo.8346799},
  url       = {https://github.com/scottprahl/laserbeamsize},
  publisher = {Zenodo}
}laserbeamsize is distributed under the terms of the MIT license.