This repository contain R-tips covering varied topics such as data wrangling, data visualization, mapping and more to help me learn R stuff.
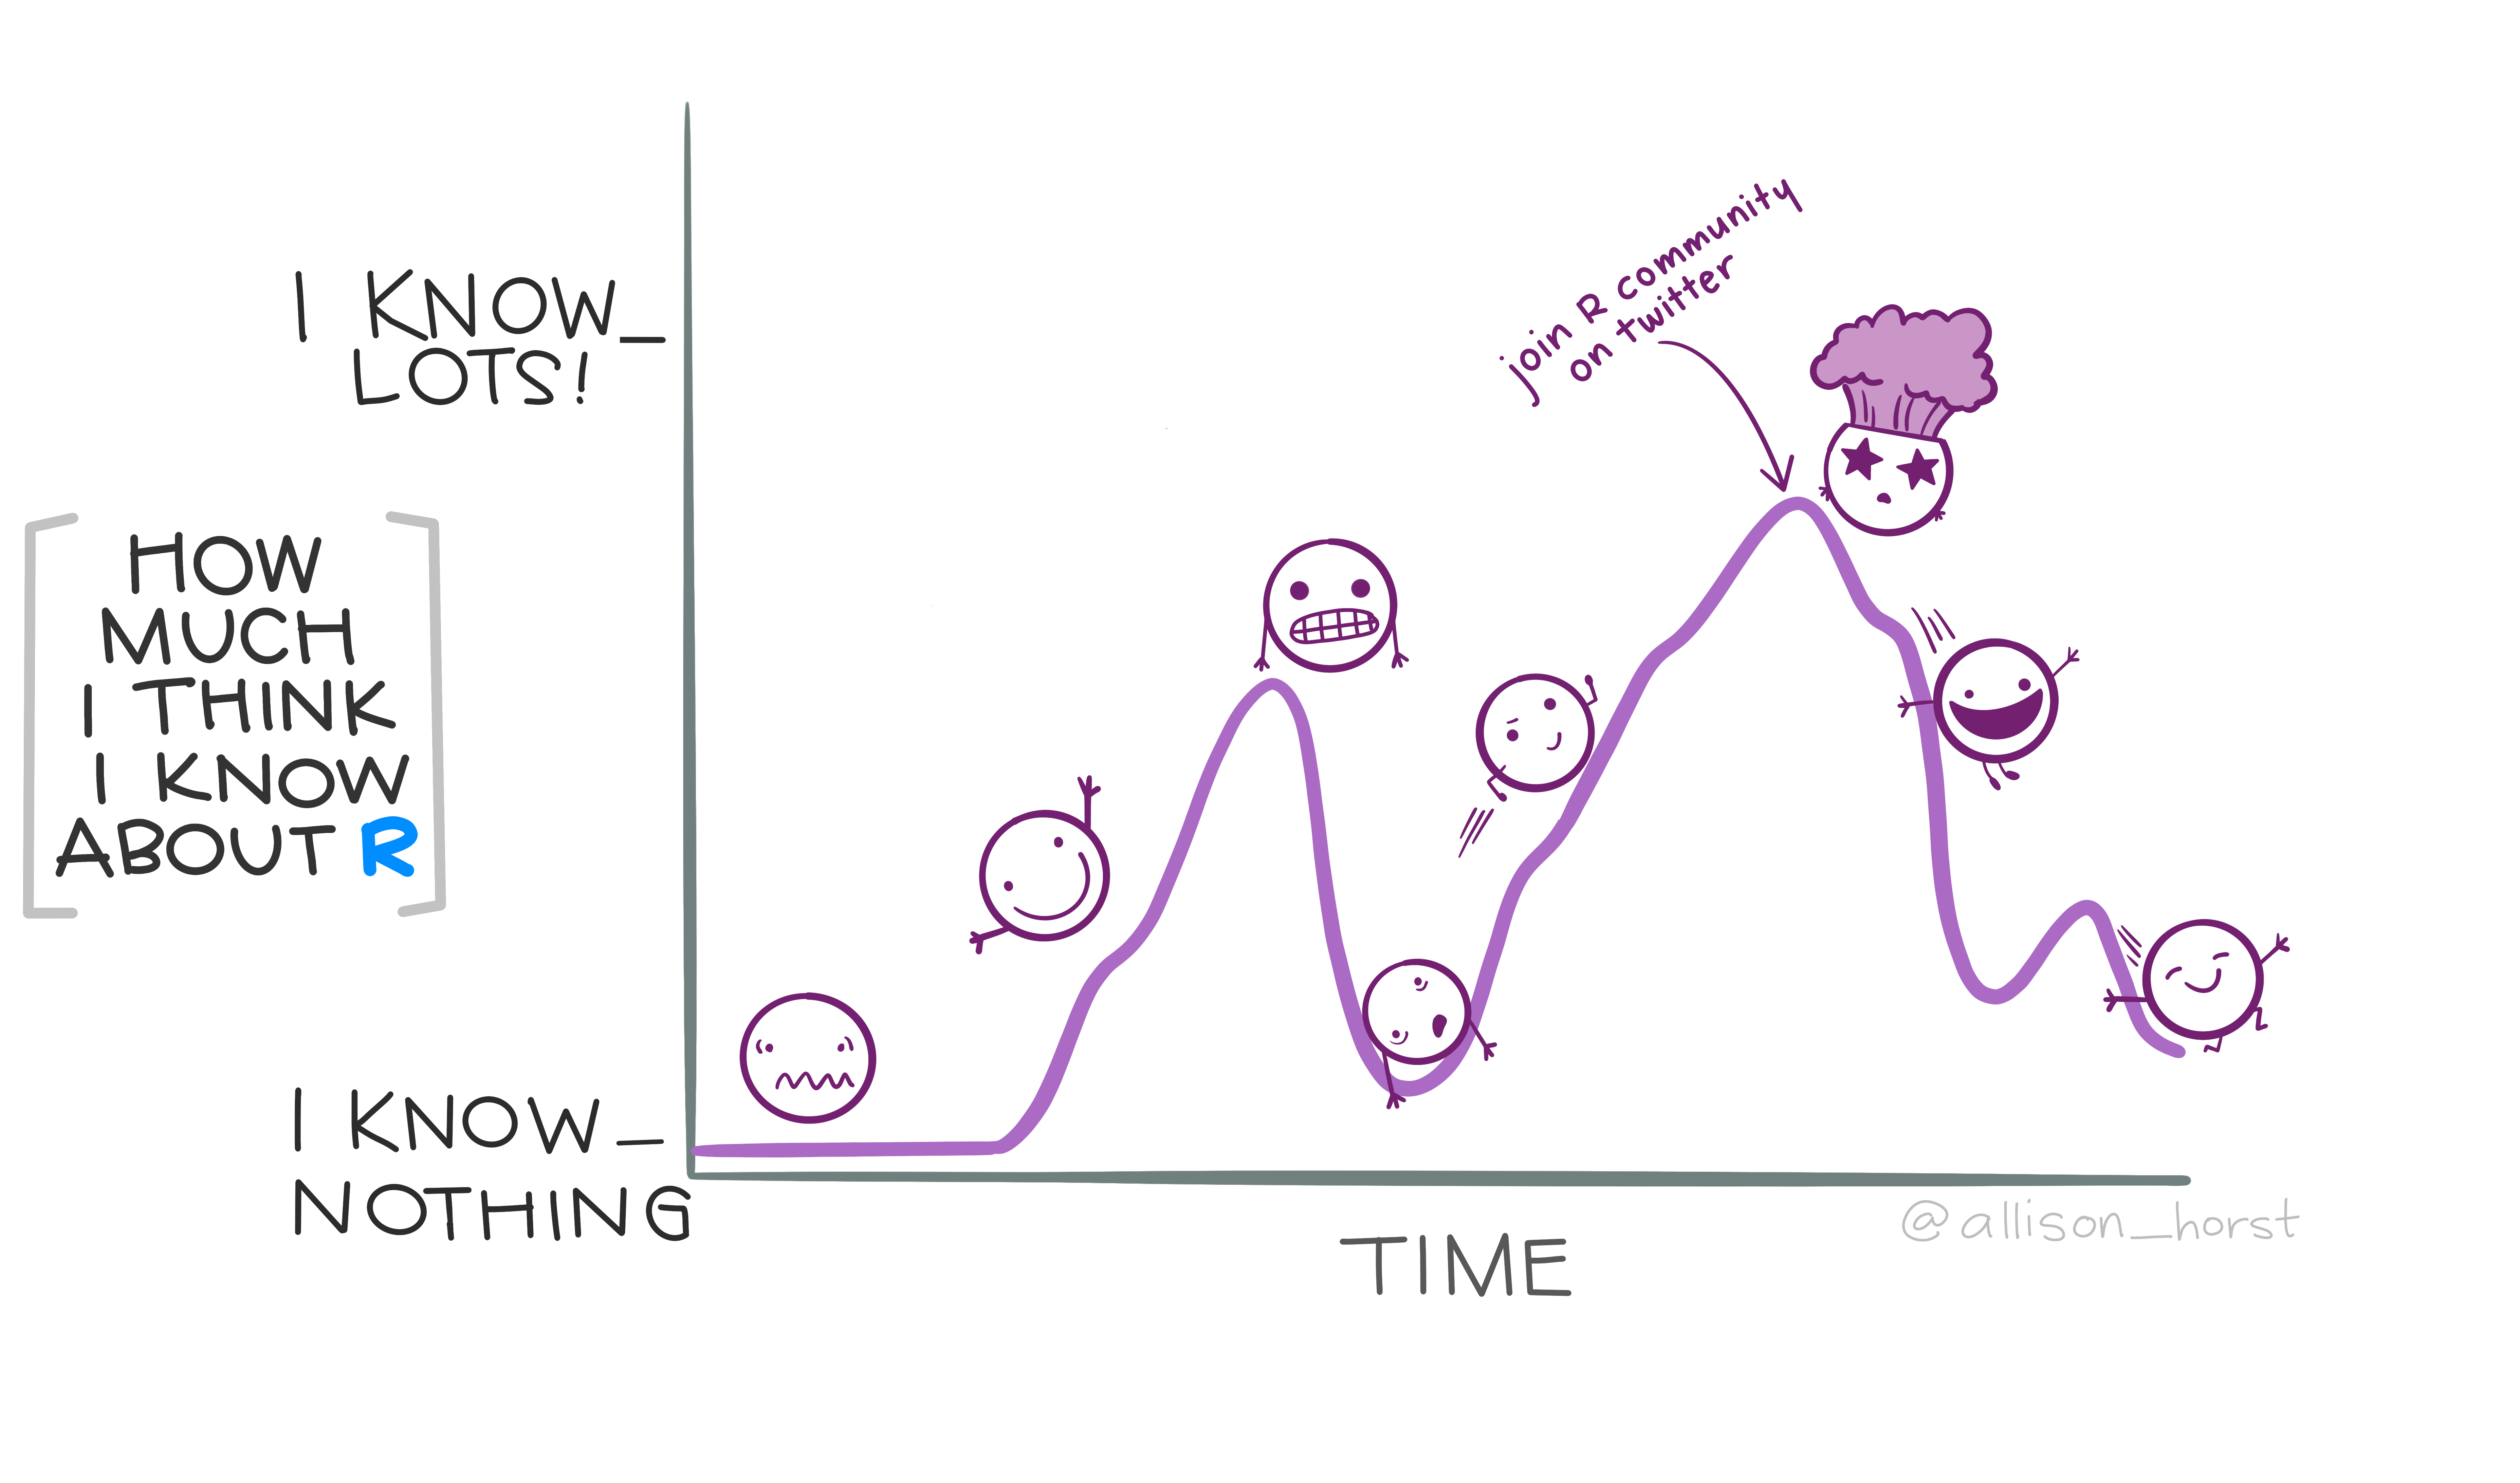
Artwork by @allison_horst
Thanks to erikaduan for the inspiration of making a clean repo to help me learn more effectively.
tidyversebooster by Christian Burkhart
ggplot2fundamentals by Christian Burkhartggplot2graphic design by Cedric Scherer- Hands–On Data Visualization with
{ggplot2}: Concepts by Cedric Scherer - Hands–On Data Visualization with
{ggplot2}: Custom Design by Cedric Scherer ggplot2print ready graphic by Maarten Lambrechts- The Glamour of Graphics by Will Chase
- ggplot2-uncharted by Yan Holz and Cedric Scherer
- Mapping Geographic Data in R, with
ggplot2by Maarten Lambrechts - Mapping with R by Charlie Hadley
Quartoworkshop by Thomas Mock
- Fill area between lines - viz
- Call Refugee Data Finder API - api - Update needed
- Call ArcGIS REST API - map/api
- Call Activity Info API - api
- Bind multiple excel doc - doc
- Download sharepoint files - doc
- ArcGIS Bridge example - doc
- sf, simple Features - map
- terra, raster data - map
- countrycode, standardize country names - map
- spData / spDataLarge, data for maps - map
- tmap, thematic maps - map
- mapsf, thematic maps - map
- layer, multi layer maps - map
- esri2sf, import esri webservice - map
- leaflet, interactive maps / leaflet.mapboxgl, include mapbox in leaflet - map
- geofacet, create facet by geo location - map
- qgisprocess - map