




Consumer Research · Data Science · Information Design · Art
Insights & Analytics Lead @ Visa | Dubai, UAE
Where rigorous research and data science marry art.


Three worlds converge in my work: research, data, and art.
I am a consumer researcher and data scientist who treats data as a narrative medium. Numbers describe; design explains. My work takes empirical research — surveys, behavioral data, millions of search queries, archival text — and turns it into visual stories that reveal patterns numbers alone cannot explain.
With experience across agencies and corporate environments in APAC & CEMEA, currently at Visa Inc, I work on consumer behavior insights, big data patterns, and the craft of making both legible.
| Research & Analytics | Consumer behavior, survey science, qualitative and quantitative methods |
| Data Science | Large-scale behavioral datasets, engineered variables, statistical modeling |
| Information Design | Charts, perceptual maps, and visual explanations built from data |
| Art | Code-based generative art and studio ceramics — the same patterns, by hand |
One chart from my piece The $19.64 Trillion Club and What It Actually Looks Like Inside — Forbes billionaire data enriched with World Bank figures and 13 engineered variables, drawn as a proportional spiral where each petal's area is a group's share of wealth:

Algorithmically drawn — one line per unit of wealth share. Click through for the full interactive article.
Wardrobe Dissatisfaction as Identity Expression in Cross-Cultural Synthetic Qualitative Research SSRN — A research paper exploring wardrobe dissatisfaction as identity expression, using cross-cultural synthetic qualitative methods — part of my broader work on synthetic respondents and AI-assisted research methodology. Companion dataset: Wardrobe Paradox Synthetic Corpus — 30 synthetic in-depth interviews across 12 markets.


theresearchedge.co — an open, independent platform making rigorous research methodology accessible, practical, and free for social scientists, market researchers, and data professionals. Peer-review-grounded articles, open-source browser tools, datasets, and workflows.
A complete choice-based conjoint (CBC) platform that runs entirely in your browser — no uploads, your data never leaves your device. Open the tools page
- Design balanced experimental study plans with diagnostics
- Estimate part-worth utilities, attribute importance, and willingness-to-pay
- Latent-class market segmentation
- Revenue-focused market simulator for concept testing
- 95% confidence intervals, HTML reports, publication-ready visuals
- Works offline after load, with plain-language guidance at every step
| Tool | What it does |
|---|---|
| Correspondence Analysis Map | Turn numerical grids into perceptual maps, in the browser |
| GenAI on Quantitative Survey Data | Claude Code skills + Python workflow for survey analysis |
| Qualitative Text Analysis | Structured, method-grounded analysis of transcripts and open-ends |
| Synthetic Consumers | A thinking guide on synthetic respondents in market research |
Plus nine (and counting) methodology deep-dives: survey design as instrumentation, synthetic research, AI in qual and quant analysis, sampling theory, measurement science, and causal inference.
Information design is where the research and art sides meet — the craft of making data legible.
Info Design for GenAI (mirror: infodesign.netlify.app) — a curated library of 210 chart & infographic designs, each with a full specification and a ready-made prompt for generative AI tools. Find a design, copy the spec, add your data — you get the visual, not a pile of code.
 |
 |
|---|---|
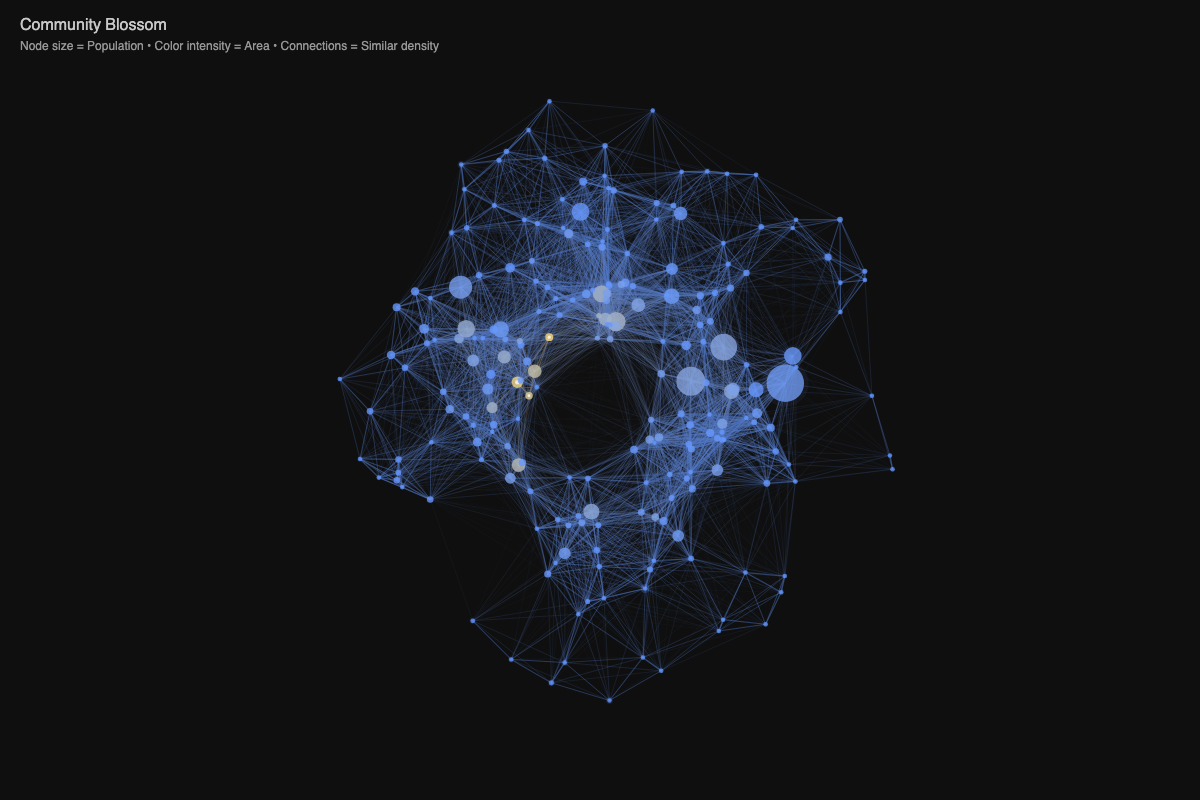
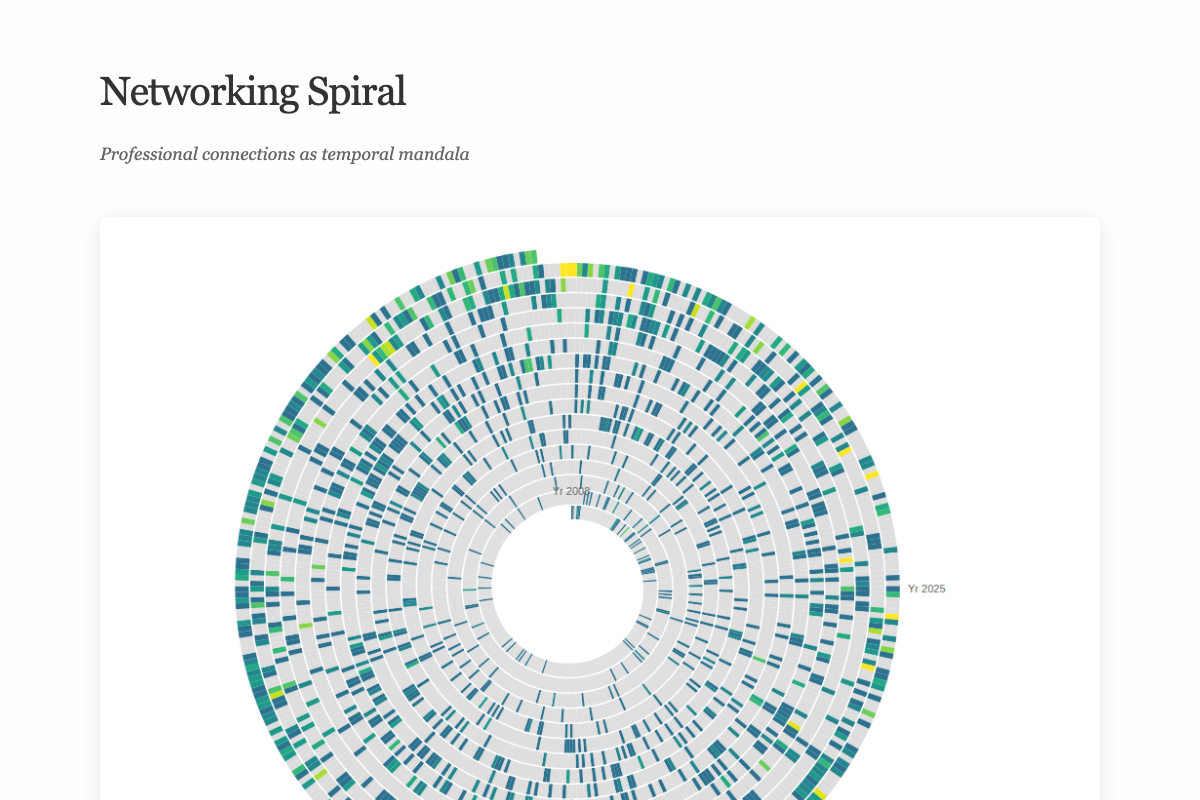
| Community Blossom — demographics as an organic network | Networking Spiral — professional connections as temporal mandala |
More visual work on the portfolio's information design gallery.
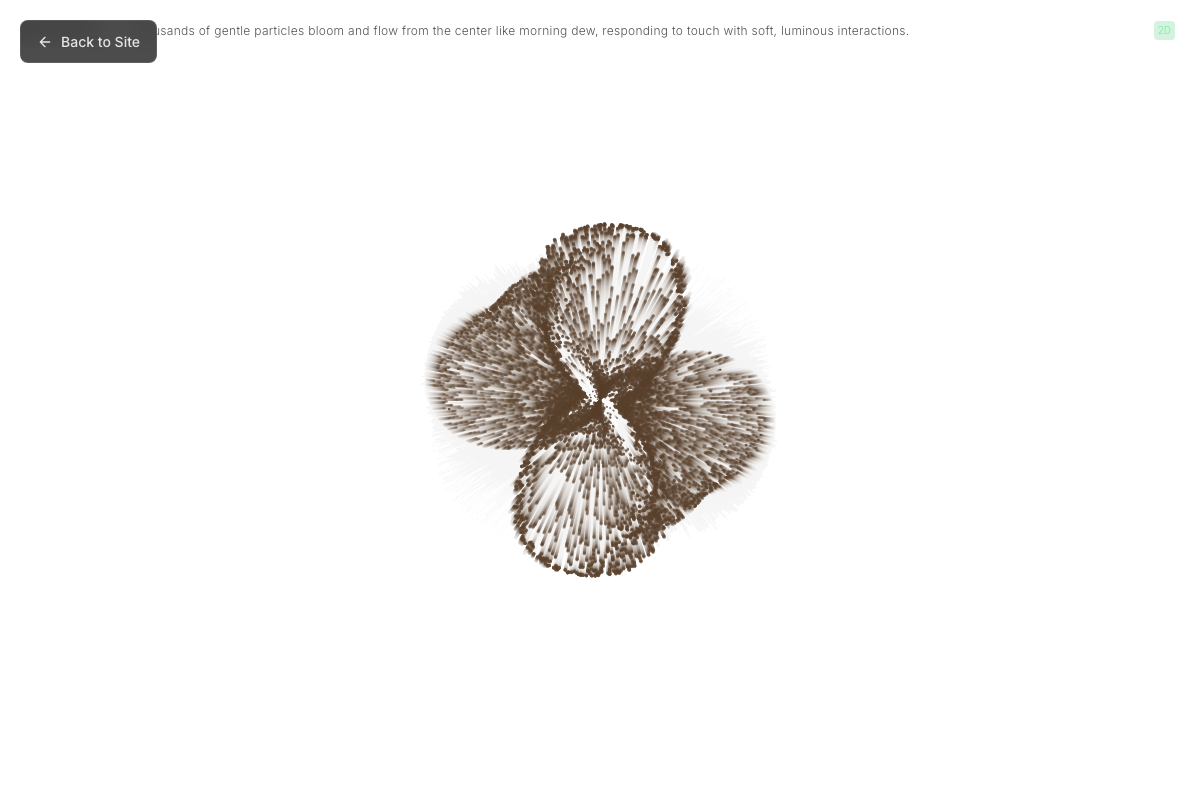
ardcode.netlify.app — an interactive digital art gallery of 10 artworks exploring philosophical concepts through code: particle galaxies, breathing mandalas, sacred geometry, nature's algorithms. Algorithms become the brush; data becomes the canvas. Navigate by scroll, keyboard, or touch — with water-ripple physics and audio-visual integration. (Source on GitHub)
 |
 |
|---|---|
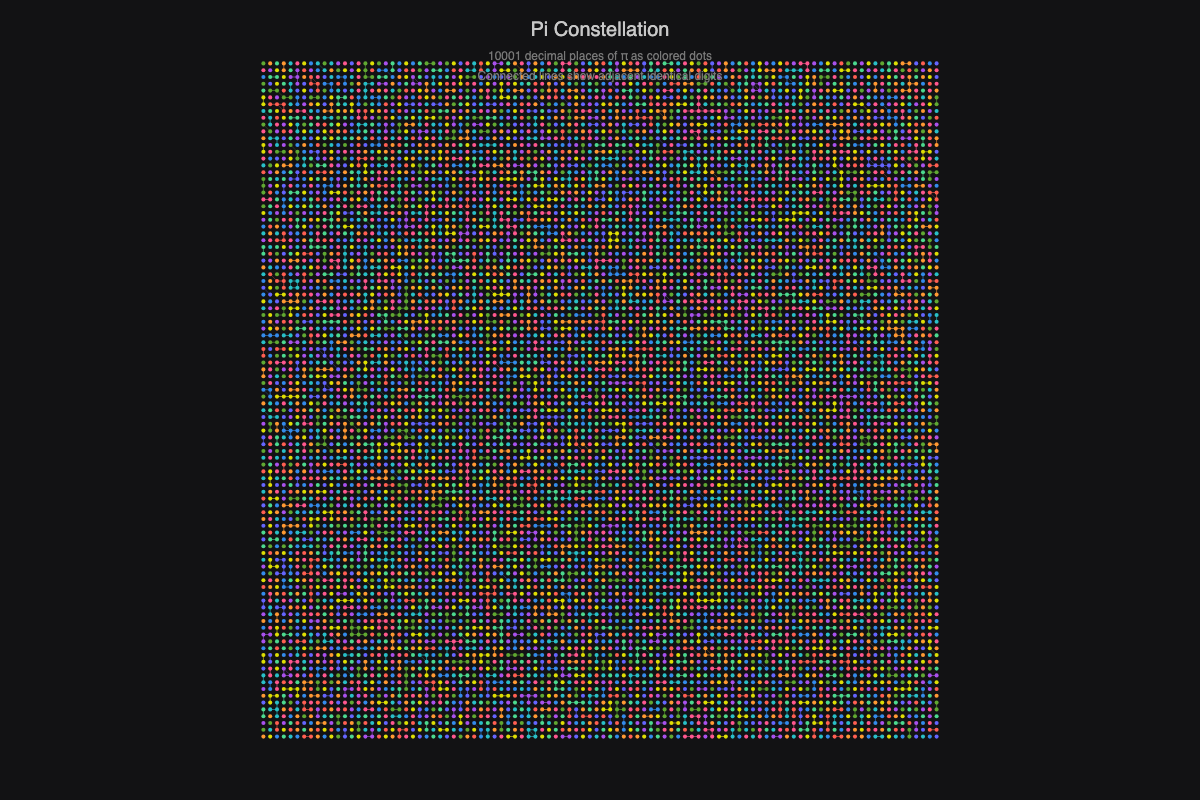
| ARDCode — thousands of particles bloom from the center | Pi Constellation — 10,001 decimal places of π as colored dots |
Connect with Gandhi (repo) — Interactive exploration of Gandhi's 45,458 collected works through a radial cluster-tree visualization. Dense archival material turned into an explorable, spatial knowledge interface.
Measurement Scales — Validated measurement scales and research instruments for consumer behavior and social research.
Datasets I've built and published on kaggle.com/vpst18:
| Dataset | What's inside |
|---|---|
| The "No Hello, How Are You" Debate | Text corpus around the online etiquette debate on greeting-free conversation |
| Discussions on Rich vs. Poor | Conversations about wealth dynamics from public forums — the raw material behind my wealth-patterns writing |
| Wardrobe Paradox Synthetic Corpus | 30 synthetic in-depth interviews on wardrobe dissatisfaction across 12 markets — companion to the SSRN paper |
| Synthetic Data — South Africa Beauty Market | An original-to-synthetic dataset pair for evaluating synthetic market research data |
Data stories from the portfolio — everyday observations meet behavioral research:
- The $19.64 Trillion Club and What It Actually Looks Like Inside — 3,384 billionaires, $19.64 trillion, and the inequality inside the club of the ultra-wealthy. Interactive, built from Forbes data and 13 engineered variables. (2026)
- 18,528 Country Pairs. Most Have Never Made a Couple. — What international marriage data reveals about how the world actually mixes. (2026)
- What Happens When You Analyze Millions of Coffee Searches? — The 3 AM questions people whisper into search engines. (2025)
- Invisible Workers: Why Do Trucks Carry Teddy Bears? — An ethnographic look at a small ritual hiding in plain sight. (2025)
- A Decade Overnight Success: What 24,653 Devices Reveal About Innovation — Budget phones, not flagships, drive innovation adoption. (2025)
- Mapping Collective Vision of the Future — Thousands of predictions, clustered into what we collectively expect. (2025)
- Can Synthetic Data Help Make Sense of Fragmented Market Research? — The case for synthetic respondents, carefully. (2024)
- Do Facts Change Minds? — The psychology of why evidence alone rarely persuades. (2024)
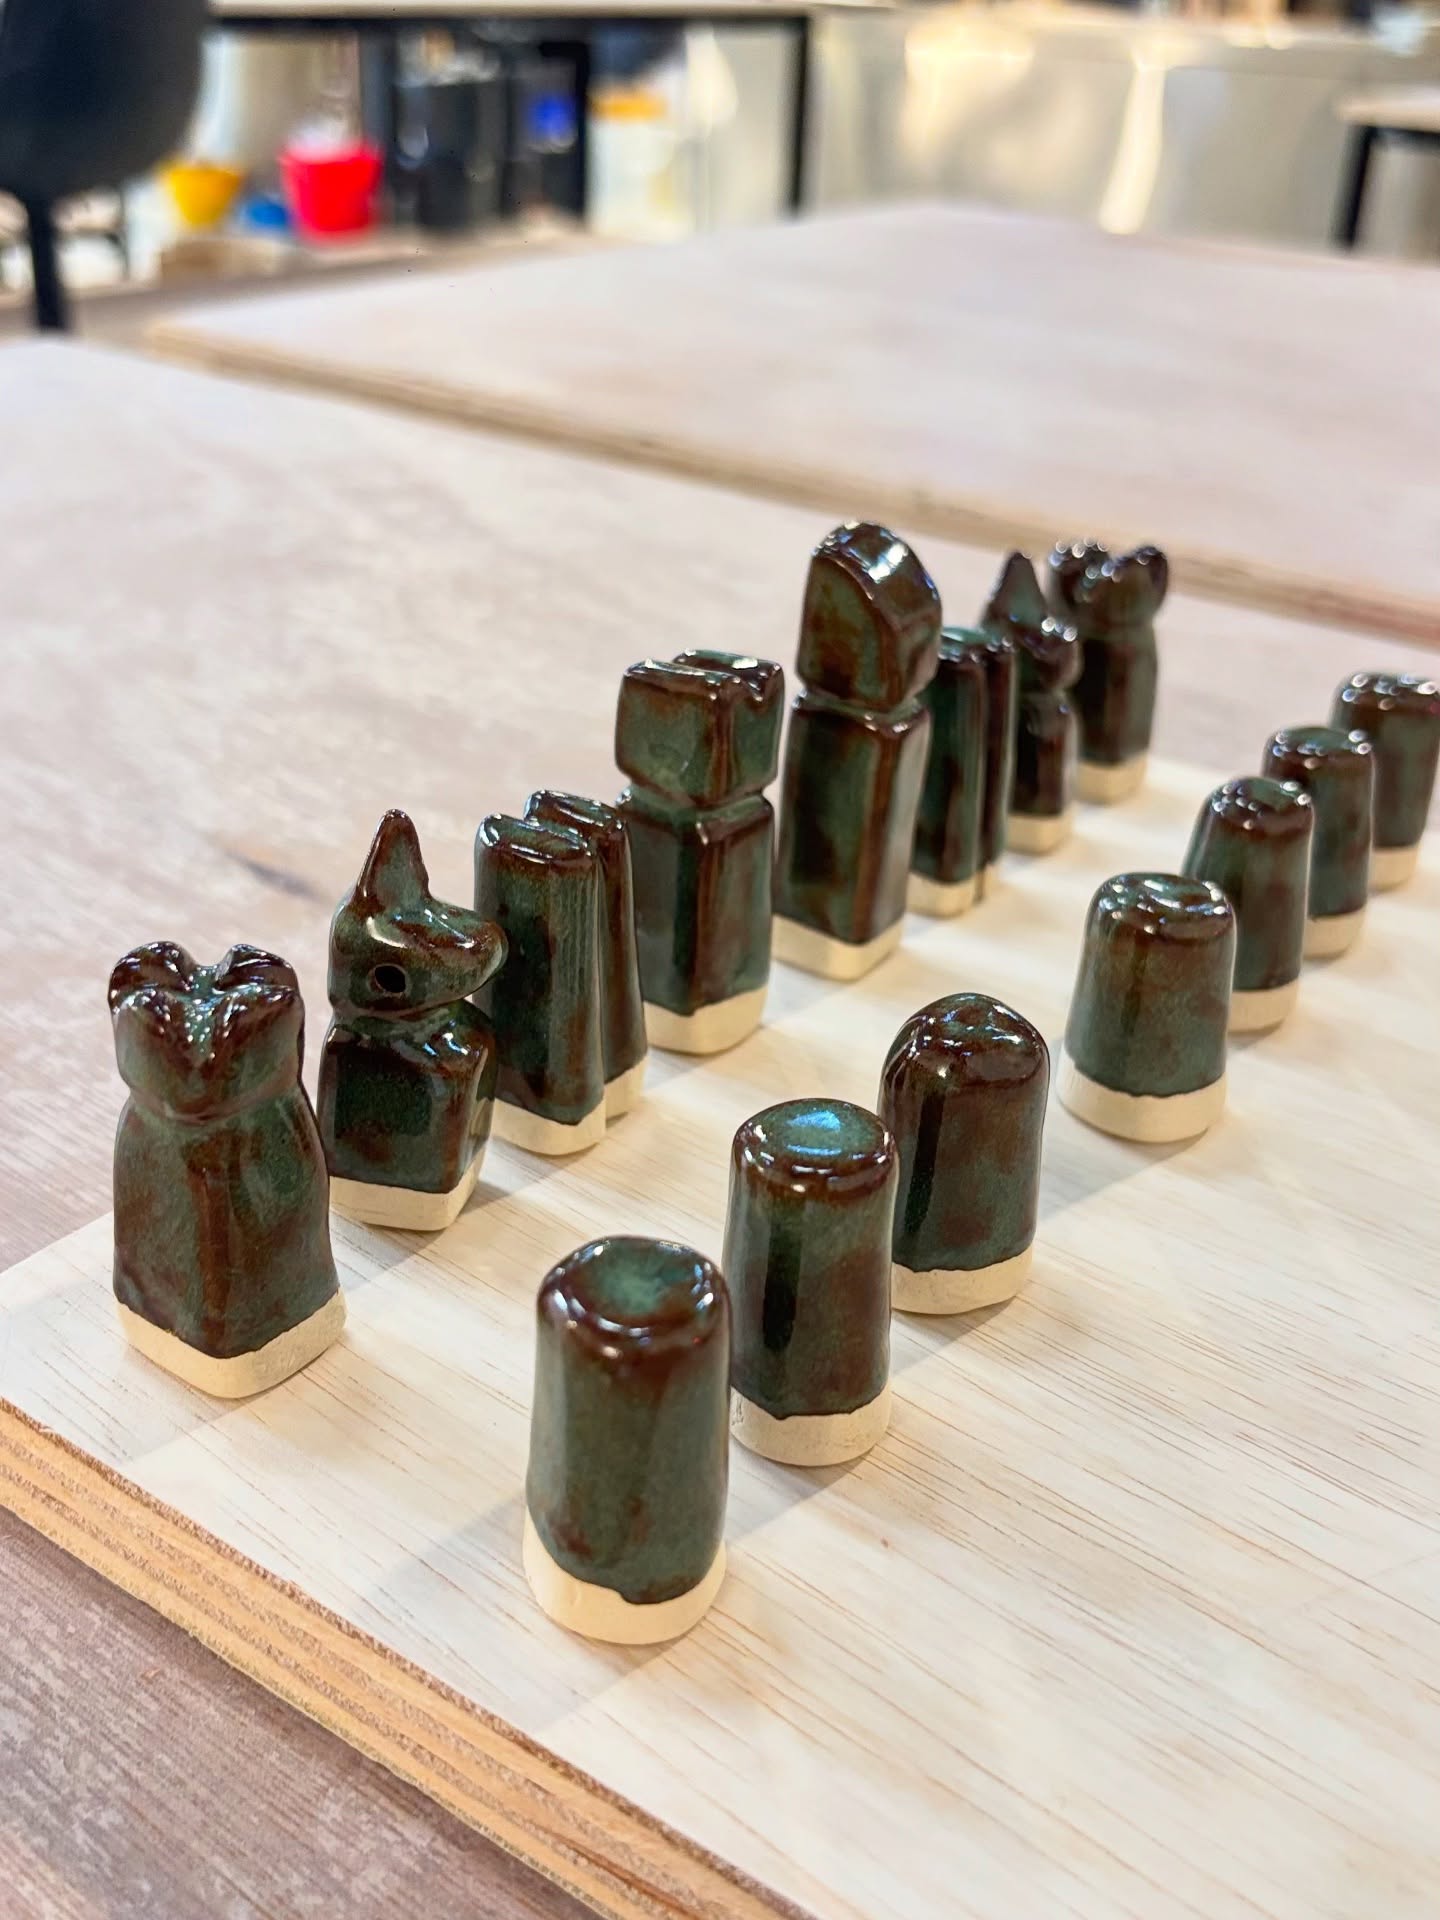
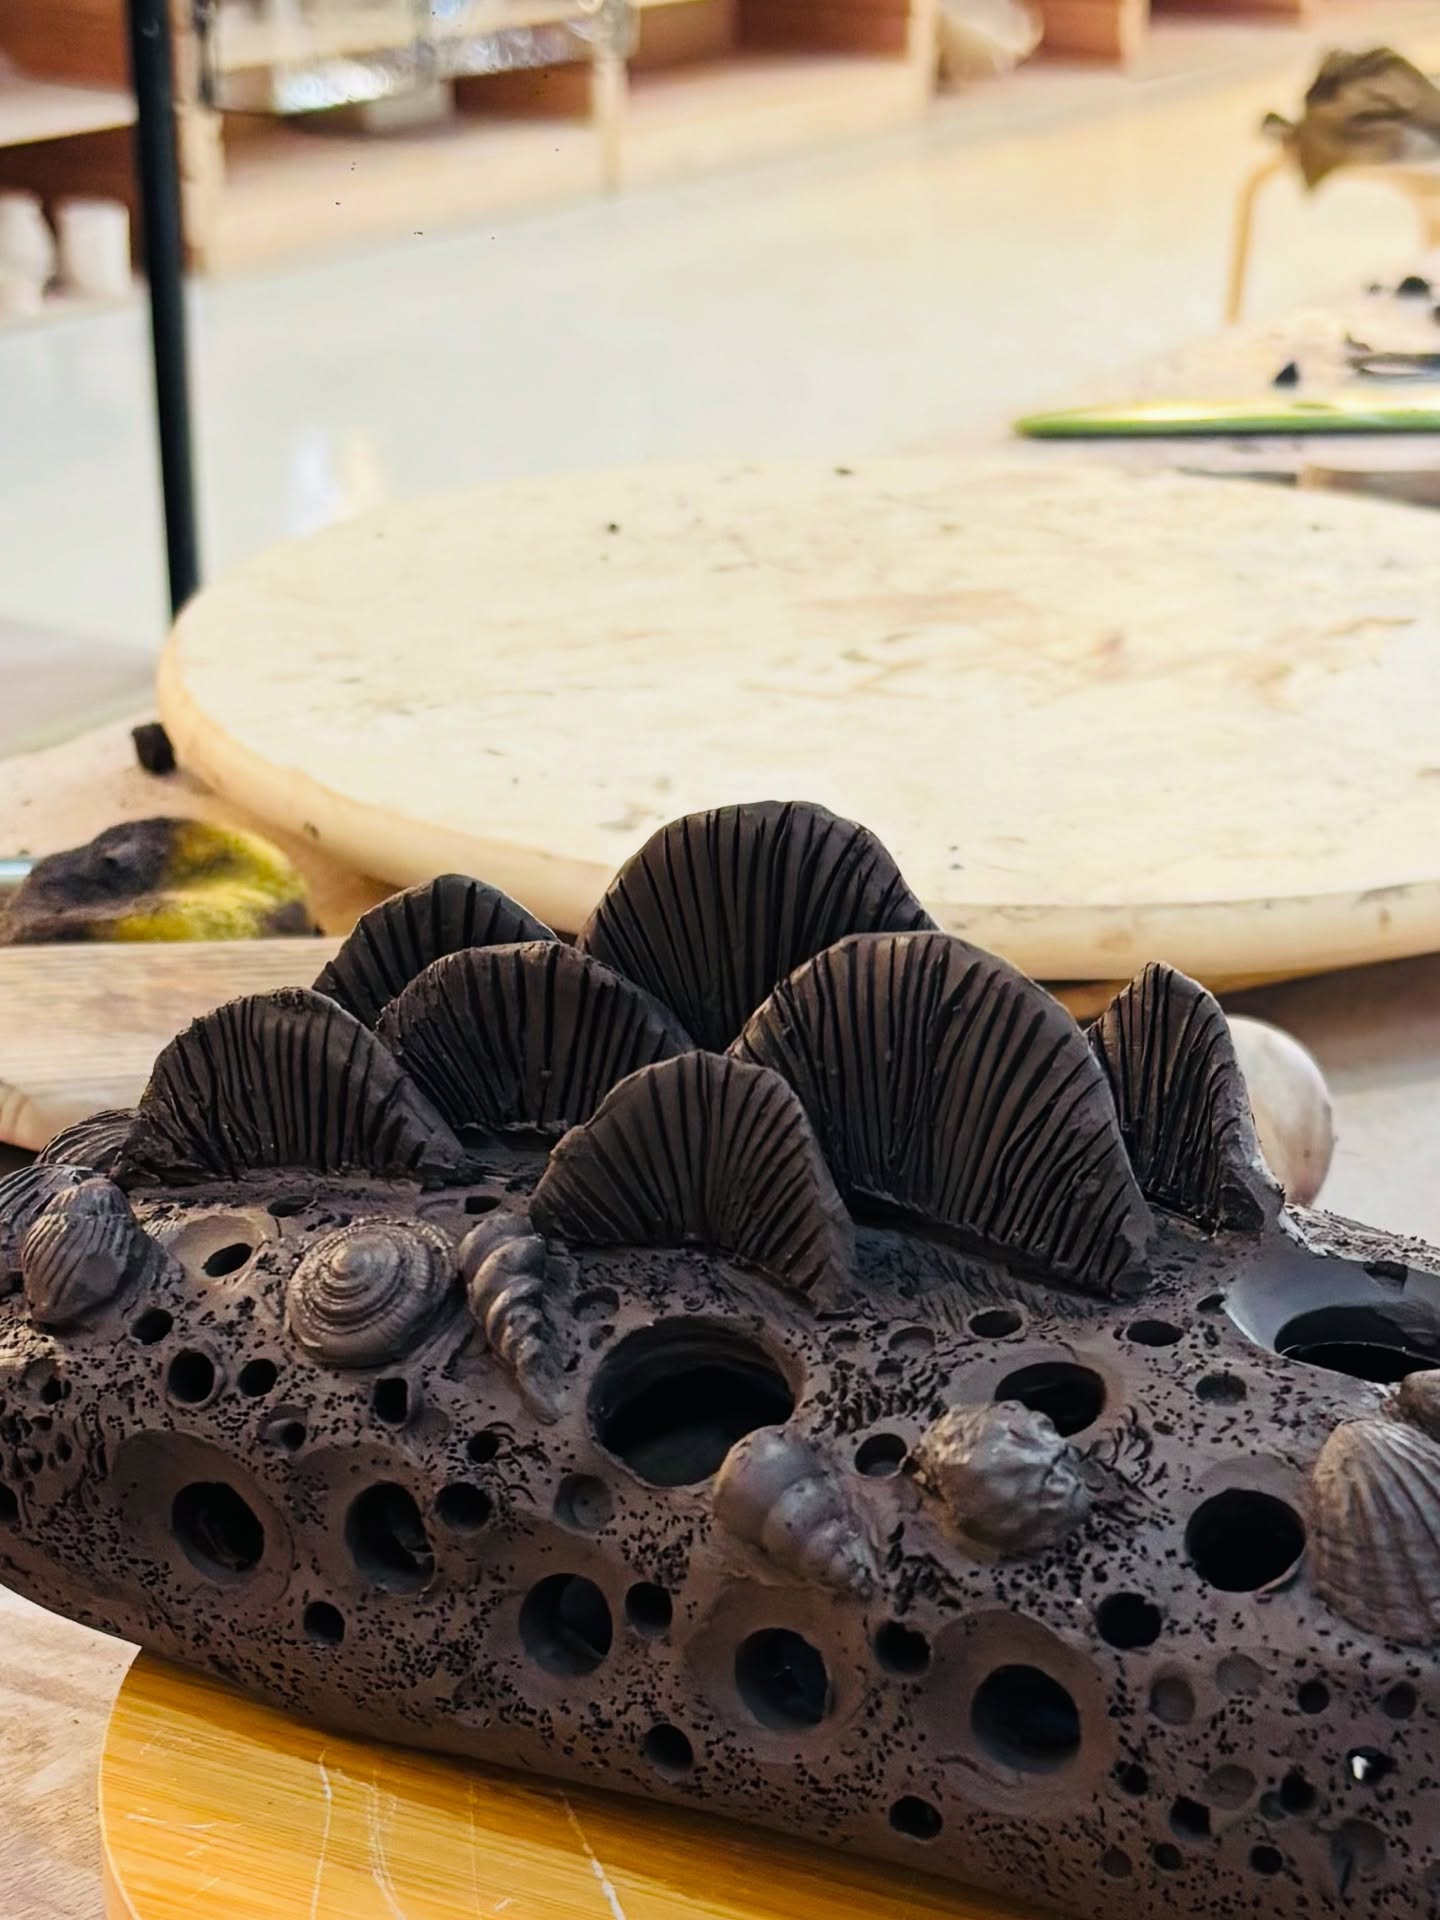
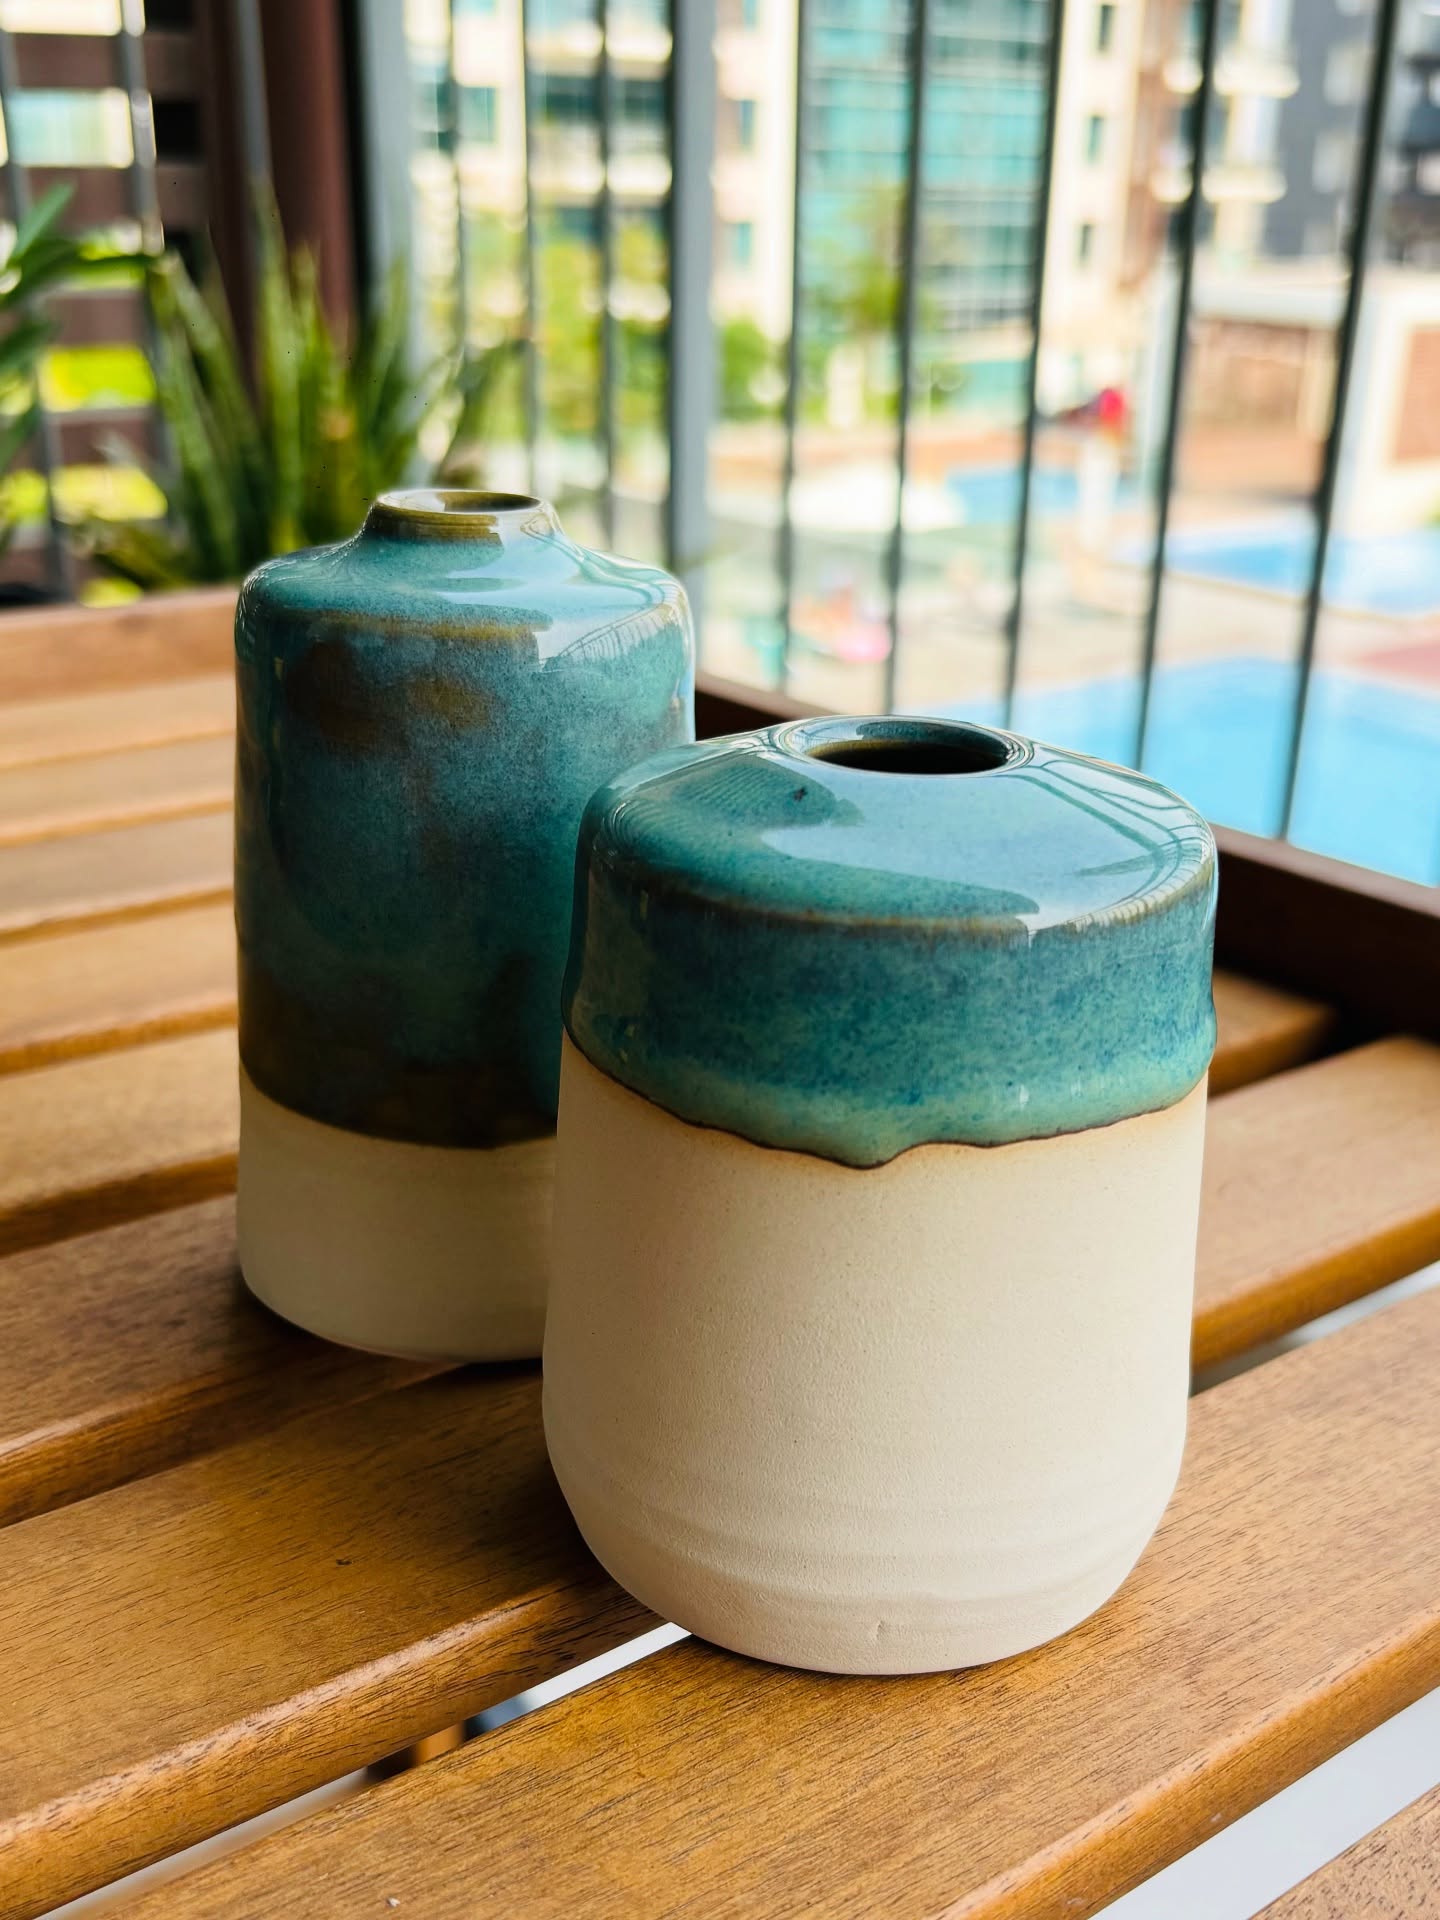
The same instinct for pattern, worked by hand — ceramics from the studio:
 |
 |
 |
|---|
Hand-built ceramic chess set · sea-floor study in black clay · turquoise vessels — full gallery
- Growing Conjoint Studio and the open tool suite on The Research Edge
- Expanding the Info Design for GenAI library
- Synthetic data and GenAI applications in market research — including published work on SSRN
- New art forms — paper folding, origami, clay, and wood
- Studying deeper human behavior
"Uncovering insights from data by day, shaping clay and code into art by weekend"
vtmade.netlify.app · theresearchedge.co · ardcode.netlify.app