Slope chart
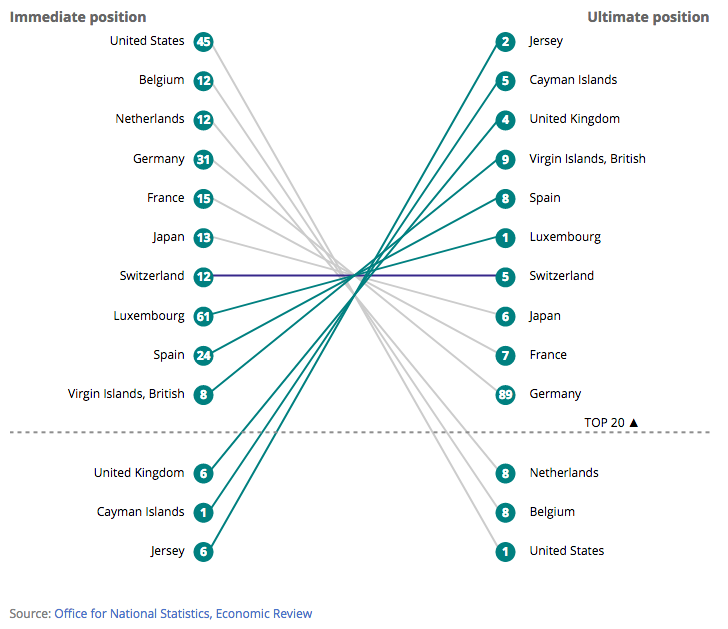
This chart is good for
- Ranking
This template was used in
The files for each chart should be of the following format:

The config file contains all the variables which you can adjust. Data.csv contains the data for your graph. The lib folder contains javascript libraries used. You'll also need the images folder.
If you’re making several charts they can share the same “lib” file as follows


To make a responsive line chart save your data in csv form of the following format:
| name | leftValue | rightValue | leftRank | rightRank | leftCustomRank | rightCustomRank |
|---|---|---|---|---|---|---|
| A | ||||||
| B | ||||||
| C | ||||||
| D |
It’s important to insure the column names are exactly as they appear in the template.
Open the “config.json” file in your preferred text editor.
These contain the main variables which the chart will need and will possibly need changing for each new chart.
"slopeType" takes either "rank" for a slope chart based on ranks or "value" for a slope chart based on the actual values.
ifValueShowRanks can be true or false. If set to true and the slopeType is value, then it will draw circles on the slope chart. It will use the ranks from leftCustomRank and rightCustomRank in the data file.
ifRankShowValue can be set to true or false`. If true, it will add data values to a rank chart.
dataFile specifies the name of the data file.
leftRightTitles specify the heading titles for the left side and the right side.
sourceText and sourceURL set the source at the bottom of the graphic.
sortby takes either ascending or descending as arguments and changes whether it goes top to bottom, bottom to top.
yAxisScale takes auto_zero_max, auto_min_max or can be specified with an array.
yAxisBreak looks for a number and draws a line and add text from yAxisBreakText. A break in a rank chart can be made by specifying ranks that skips a number in them, and using the custom rank columns.
The height of the svg is set as a multiple of gHeight_sm_md_lg for the three different sizes of screen.
These variables are ones that may require slight adjustment for a new chart however will remain the same for the majority of charts.
The margins for the chart can be adjusted here. [top, right, bottom, left] there are options for each screen size, small (mobile), medium (tablet) and large (desktop). The margins should be as small as possible whilst still displaying the text as there are a second set of margins once it is iframed on visual.ons. Generally these should not require adjusting for line charts but will almost certainly need adjusting for bar charts.
"margin_sm": [20, 10, 35, 30],
"margin_md": [20, 10, 35, 30],
"margin_lg": [20, 10, 35, 30],
The point at which the chart changes from small (mobile) to medium (tablet) to large (desktop) view is specified here. This should not normally require adjusting.
"mobileBreakpoint" : 501,
"mediumBreakpoint":600
The data file skips 3 in the Rank columns, and uses ifRankCustomRank to use the custom ranks. yAxisBreak can be set to 3.
| name | leftValue | rightValue | leftRank | rightRank | leftCustomRank | rightCustomRank |
|---|---|---|---|---|---|---|
| A | 1 | 5 | 1 | 4 | ||
| B | 2 | 4 | 2 | 3 | ||
| C | 4 | 2 | 3 | 2 | ||
| D | 5 | 1 | 4 | 1 |
The y axis is only set once so to set the circle in the right place, you'll have to put the data values in ranks, and use custom ranks.
| name | leftValue | rightValue | leftRank | rightRank | leftCustomRank | rightCustomRank |
|---|---|---|---|---|---|---|
| A | 100 | 450 | 100 | 450 | 1 | 4 |
| B | 200 | 300 | 200 | 300 | 2 | 3 |
| C | 250 | 225 | 250 | 225 | 3 | 2 |
| D | 450 | 125 | 450 | 125 | 4 | 1 |