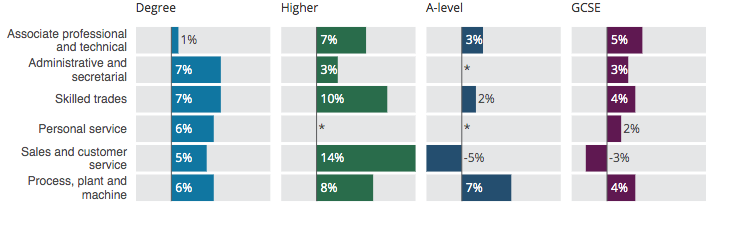
Split bar chart
The files for each chart should be of the following format:
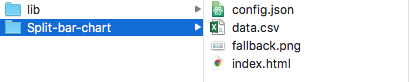
The config file contains all the variables which you can adjust. Data.csv contains the data for your graph. The lib folder contains javascript libraries used. You'll also need the images folder.
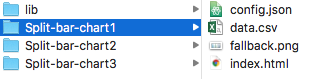
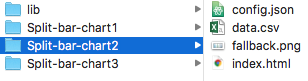
If you’re making several charts they can share the same “lib” file as follows:
Save your data in csv form of the following format:
| xcategory | ycategory | amount |
|---|---|---|
| Degree | Associate professional and technical | 15.1 |
| Higher | Associate professional and technical | 41.9 |
| A-level | Associate professional and technical | 39.4 |
| Degree | Administrative and secretarial | 15.1 |
| Higher | Administrative and secretarial | 41.9 |
| A-level | Administrative and secretarial | 39.4 |
Open the “config.json” file. You can open this in a text editor such as Notepad++ or TextEdit or download a code editor such as Atom, Dreamweaver, Brackets or Sublime Text 2.
These contain the main variables which the chart will need and will possibly need changing for each new chart.
"graphic_data_url": "data.csv",
where data.csv is the name of the data file, must be in csv form.
"sourceText":["Office for National Statistics – Annual Population Survey 3-year pooled dataset 2015-17"]
The source text and link is set with the above options.
"xAxisLabel":"%", sets the label of the x axis.
"xAxisScale":[-20,50] sets the range of the x axis. Other options include auto_min_max or auto_zero_max.
"barHeight_sm_md_lg" : [30,30,30], set the height of the bar chart in the three different view sizes.
"margin_sm": [8, 0, 25, 127],
"margin_md": [8, 0, 25, 130],
sets the margin for the two view sizes.
"mobileBreakpoint" : 610, sets the width for the mobile/small view.